Building Enclosure logo
search
cart
facebook twitter linkedin youtube instagram Spotify Podcasts Apple Podcasts Spotify Podcasts Apple Podcasts
  • Sign In
  • Create Account
  • Sign Out
  • My Account
Building Enclosure logo
  • NEWS
    • Breaking News
  • SECTIONS
    • Columns
    • Project Profiles
    • Trade Shows
    • Sponsor Insights
  • SYSTEM DESIGNS
    • Low-Slope Roofs
    • Pitched Roofs
    • Metal Roofing Materials
    • Waterproofing
    • Sustainability
    • Insulation
    • Exterior Claddings
    • Wall Systems
    • Building Envelope
  • BLOG
    • The BE Blog
  • MEDIA
    • Podcasts
    • Webinars
    • Quiz
    • Videos
    • Polls
    • Interactive Spotlights
    • Newsletter
    • Photo Galleries
  • DIRECTORIES
    • Directory: Blue Book
    • Directory: Roofing Resource
  • PRODUCTS
  • TECHNICAL
    • Codes
      • Waterproofing
      • Roofing
    • Details
      • Waterproofing
      • Roofing
  • CONTINUING ED
  • ABOUT
    • Advertise
      • Editorial Calendar
    • Contact
    • eMag Archive Issues
  • SIGN UP!

Comparing Climate-Related Design Conditions for Major U.S. Cities

By Daniel Overbey
Header - BE 1170x658-climates.jpg

Graphic courtesy of author.

May 27, 2022

A building's enclosure and mechanical systems must be designed to confront the weather extremes of its locale. The weather "extremes" can be described in myriad ways using several data. However, three of the most common are dry-bulb temperature, wet-bulb temperature, and degree-days.


Comparing Design Dry-Bulb Temperatures

Winter design dry-bulb (99%): This is the outdoor temperature that will, in a typical year based on long-term averages, , be the lowest experienced during 99% of the hours in a year. This means that approximately 1% of the hours (88 hours in a year) will experience temperatures lower than this value. 

Summer design dry-bulb (2%): This is the outdoor temperature that will, in a typical year based on long-term averages, be the highest experienced during all but 2% of the hours in a year. This means that approximately 2% of the hours (176 hours) will experienced temperatures higher than this value. 

Design teams typically forego designing for the most extreme percentile of hours in the winter or summer because to do so would risk over-designing a system and taking on an associated economic burden with very little return.

A review of the design dry-bulb temperature ranges between Winter and Summer for the 20 largest cities in the U.S. may bring some interesting observations to bare (Fig. 1). Although Denver gets really cold and Phoenix gets really hot, the U.S. Midwest must confront considerable extremes in both the heating and cooling seasons. Note the three cities with the greatest range:

  1. Chicago, IL (85.1)
  2. Denver, CO (84.7)
  3. Indianapolis (82.3)


Figure 1: Design Dry-Bulb Temperature Ranges for the 20 Largest Cities in the U.S. Figure courtesy of Daniel Overbey. Data: ANSI/ASHRAE/IESNA Standard 90.1-2007.


Comparing Design Wet-Bulb

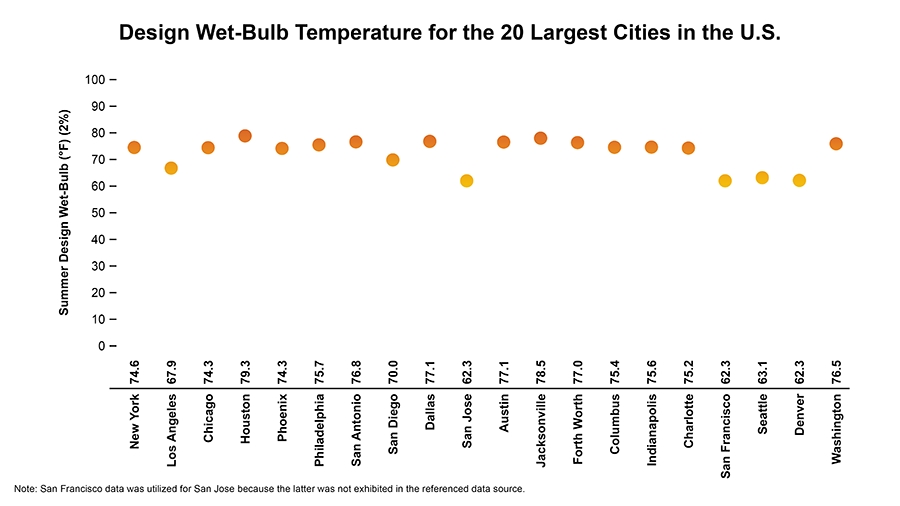
Design wet-bulb (2%): This is the outdoor temperature that will, in a typical year based on long-term averages, be the highest experienced during all but 2% of the hours in a year. This value is also used for the selection and sizing of evaporative cooling components. 

A review of summer design wet-bulb temperatures in the largest cities in the U.S. reveals two key observations (Fig. 2). First, that the design design wet-bulb is fairly comparable for many cities - even in different climate regions. Secondly, the cities with design wet-bulb temperatures in the low 60's may be ill-prepared for increasing heating patterns in the summer as much of the population may lack mechanical air-conditioning and sufficiently resilient building enclosures.


Fig 2 - Design WB (900p).jpg

Figure 2: Design Wet-Bulb Temperature for the 20 Largest Cities in the U.S. Figure courtesy of Daniel Overbey. Data: 2005 ASHRAE Handbook—Fundamentals.


Comparing Degree-Days

One might also consider the total degree-days for this same list of cities. 

If we consider the summation of the heating degree-days (base 65°F) and cooling degree-days (base 50°F), we see that the U.S. Midwest once again takes two of the top three positions (Fig. 3):

  1. Phoenix, AZ (9,535)
  2. Chicago, IL (9,477)
  3. Indianapolis, IN (9,068)


Figure 3: Heating Degree-Days (65°F) and Cooling Degree-Days (50°F) for the 20 Largest Cities in the U.S. Figure courtesy of Daniel Overbey. Data: 2005 ASHRAE Handbook—Fundamentals.


If your city has one of the most challenging annual temperature ranges; if it has a summer design wet-bulb in the mid/upper 70's; and if it is among those with the greatest total degree-days including a considerable amount of heating needs (I'm looking at you, Chicago and Indianapolis), you will have a greater climate-related burden to contend with to achieve aggressive energy-performance goals.

KEYWORDS: climate change lighting

Share This Story

Overbey   head shot 2020 3

Daniel Overbey, AIA, NCARB, LEED Fellow (LEED AP BD+C, ID+C, O+M), WELL AP is an Assistant Professor of Architecture at Ball State University and the Director of Sustainability for Browning Day in Indianapolis, Ind. His work focuses on high-performance building design and construction, environmental systems research, green building certification services, energy/life-cycle assessment modeling, and resilient design. He can be reached at djoverbey@bsu.edu.

Recent Comments

These are actually very helpful tips. It is...

This is the most beneficial blog for all...

This blog is a great resource for anyone...

Thank you for sharing this important information. I...

This is a very interesting subject of the...

Manage My Account
  • Sign up for the Newsletter
  • Online Registration
  • Manage My Preferences
  • Registration Customer Service

More Videos

Sponsored Content

Sponsored Content is a special paid section where industry companies provide high quality, objective, non-commercial content around topics of interest to the Building Enclosure audience. All Sponsored Content is supplied by the advertising company and any opinions expressed in this article are those of the author and not necessarily reflect the views of Building Enclosure or its parent company, BNP Media. Interested in participating in our Sponsored Content section? Contact your local rep!

close
  • HITT Construction headquarters
    Sponsored byBuilding Composites® LLC

    Pushing the Envelope

  • 2 construction workers and a DEXcell panel
    Sponsored byDEXcell Roof Boards

    Designing Low-Slope Roofs for Resilience

  • Bell Bank headquarters in Fargo, North Dakota
    Sponsored bySto Corp.

    Drained and Back-Ventilated Rainscreens vs Pressurized-Equalized Rainscreens

Popular Stories

graphic shows white arrows pointing to the right on a light green background

A Breakdown of Air Leakage Testing in LEED v5 BD+C

Open vs. closed cell foam in an attic

Open-Cell vs. Closed-Cell Spray Foam

skyscraper

NYC Tower Failure Offers Warning for Contractors

Building Enclosure Newsletter

BE Poll

Events

April 9, 2026

Strategies for High-Performance Below-Grade Waterproofing

Credits: 1 AIA LU/HSW ; 1 IIBEC CEH; 0.1 IACET CEU

On-Demand Designing a high-performance building enclosure requires more than just surface-level protection; it demands a rigorous, performance-based mastery of below-grade water and gas mitigation. This discussion will provide an expert-level analysis of below-grade waterproofing within the comprehensive framework of the high-performance building enclosure.

April 28, 2026

Roof Design Considerations That Prevent Installation Failures and Change Orders

Credit: 1 AIA LU/HSW; 1 IIBEC CEH; 0.1 ICC CEU

On-Demand This course provides visual examples of actual field conditions. Some good, some not so good; along with design suggestions that can cut installation costs and reduce construction change orders. Upon completion of this course, you will have a better understanding of the requirements the roofing contractor must meet to provide the specified roofing system warranty, and long-term value to the owner.

View All Submit An Event

Products

Plaster and Drywall Assemblies Manual

Plaster and Drywall Assemblies Manual

This is a comprehensive manual that goes beyond codes and standards, providing expert guidance in design, detailing, material selection and troubleshooting for plaster and drywall.

See More Products
×

Enhance your expertise with unparalleled insights.

Join thousands of building professionals today. Shouldn’t you know what they know?

SUBSCRIBE TODAY!
  • RESOURCES
    • Advertise
    • Contact Us
    • Store
    • Want More
  • SIGN UP TODAY
    • Create Account
    • Newsletter
    • Customer Service
    • Manage Preferences
  • SERVICES
    • Marketing Services
    • Reprints
    • Market Research
    • List Rental
    • Survey/Respondent Access
  • STAY CONNECTED
    • LinkedIn
    • Facebook
    • Instagram
    • YouTube
    • X
  • PRIVACY
    • PRIVACY POLICY
    • TERMS & CONDITIONS
    • DO NOT SELL MY PERSONAL INFORMATION
    • PRIVACY REQUEST
    • ACCESSIBILITY

Copyright ©2026. All Rights Reserved BNP Media, Inc. and BNP Media II, LLC.

Design, CMS, Hosting & Web Development :: ePublishing