Building Enclosure logo
search
cart
facebook twitter linkedin youtube instagram Spotify Podcasts Apple Podcasts Spotify Podcasts Apple Podcasts
  • Sign In
  • Create Account
  • Sign Out
  • My Account
Building Enclosure logo
  • NEWS
    • Breaking News
  • SECTIONS
    • Columns
    • Project Profiles
    • Trade Shows
    • Sponsor Insights
  • SYSTEM DESIGNS
    • Low-Slope Roofs
    • Pitched Roofs
    • Metal Roofing Materials
    • Waterproofing
    • Sustainability
    • Insulation
    • Exterior Claddings
    • Wall Systems
    • Building Envelope
  • BLOG
    • The BE Blog
  • MEDIA
    • Podcasts
    • Webinars
    • Quiz
    • Videos
    • Polls
    • Interactive Spotlights
    • Newsletter
    • Photo Galleries
  • DIRECTORIES
    • Directory: Blue Book
    • Directory: Roofing Resource
  • PRODUCTS
  • TECHNICAL
    • Codes
      • Waterproofing
      • Roofing
    • Details
      • Waterproofing
      • Roofing
  • CONTINUING ED
  • ABOUT
    • Advertise
      • Editorial Calendar
    • Contact
    • eMag Archive Issues
  • SIGN UP!

Visualizing Weather Data Using Climate Consultant

By Daniel Overbey
Visualizing Weather Data Using Climate
Daniel Overbey
December 28, 2015

The U.S. Department of Energy's Office of Energy Efficiency & Renewable Energy (EERE) provides public access to long-term climate data for over 2,100 locations throughout the world in formats suitable for the publicly-funded EnergyPlus whole-building energy modeling software. These files are chock-full of hourly weather data of 30-year averages for temperature, humidity, wind speeds, and much more. For residential projects and other skin-load dominated (SLD) structures, these weather files hold the clues to better adapt our design responses to the environmental conditions they will encounter. 

However, it is not clear to most designers how this information can be accessed and utilized in the design process. To state that the information contained in these weather files is dense and overwhelming would be an understatement.

For several years, I've taught environmental systems and building science courses for the Boston Architectural College’s online sustainable design certificate program and Master of Design Studies in Sustainable Design (MDS-SD) degree program. In those courses, I teach that a foundation of climate data analysis is critical to understanding what types of environmental control systems can make the biggest impact on reducing a building's heating and cooling needs. Yet, stringing together disparate web-based and printed resources for different types of climate information in various locations becomes confusing and problematic. We collect climate data in a systematic network of weather stations. There has to be a better way for students and designers to access this information.


Enter Climate Consultant

For years, Professor Murray Milne at the UCLA Department of Architecture and Urban Design (AUD) has provided several powerful, free software resources on his Energy Design Tools web page. One of the most popular programs is Climate Consultant, a free Java-based platform that takes all of that USDOE weather data and presents it in 17 different charts and/or tabulations - all of which are clear and intuitive visual expressions. Here are a few of the most compelling offerings of the software:


3D Charts

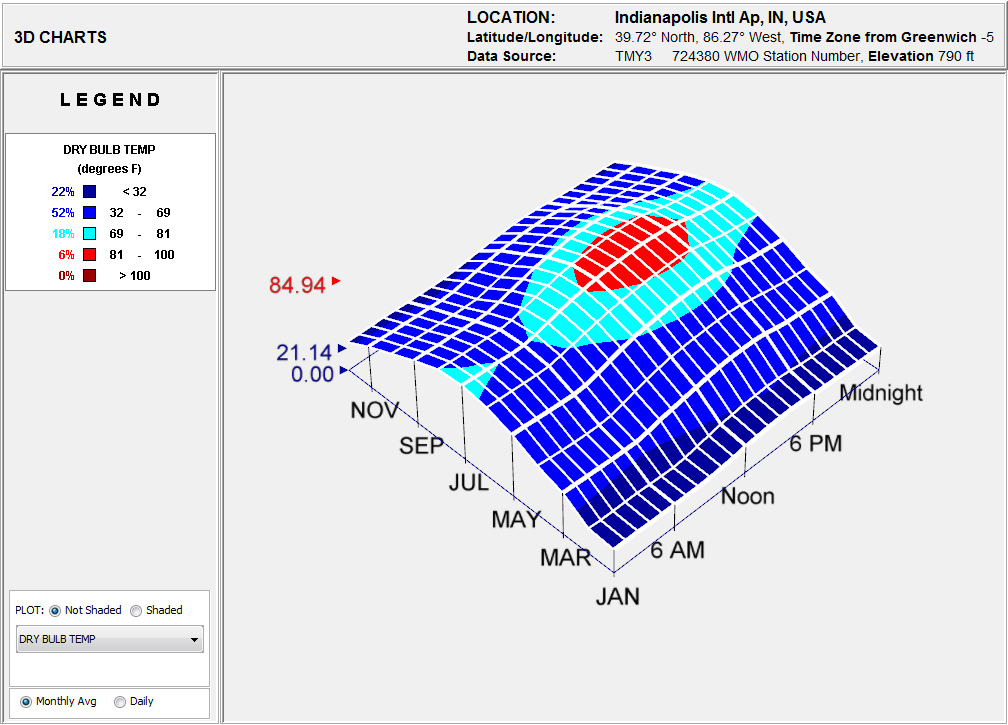
The 3D Charts allow users to visualize daily and monthly plots of weather datasets such as dry bulb temperature, relative humidity, and sky cover. Colors correspond with with categorical ranges and users can rotate the 3D visualization in order to better understand the relative variations in the dataset.

3D Charts feature in Climate Consultant plotting monthly averages of hourly dry bulb temperatures throughout the year.


Psychrometric Chart

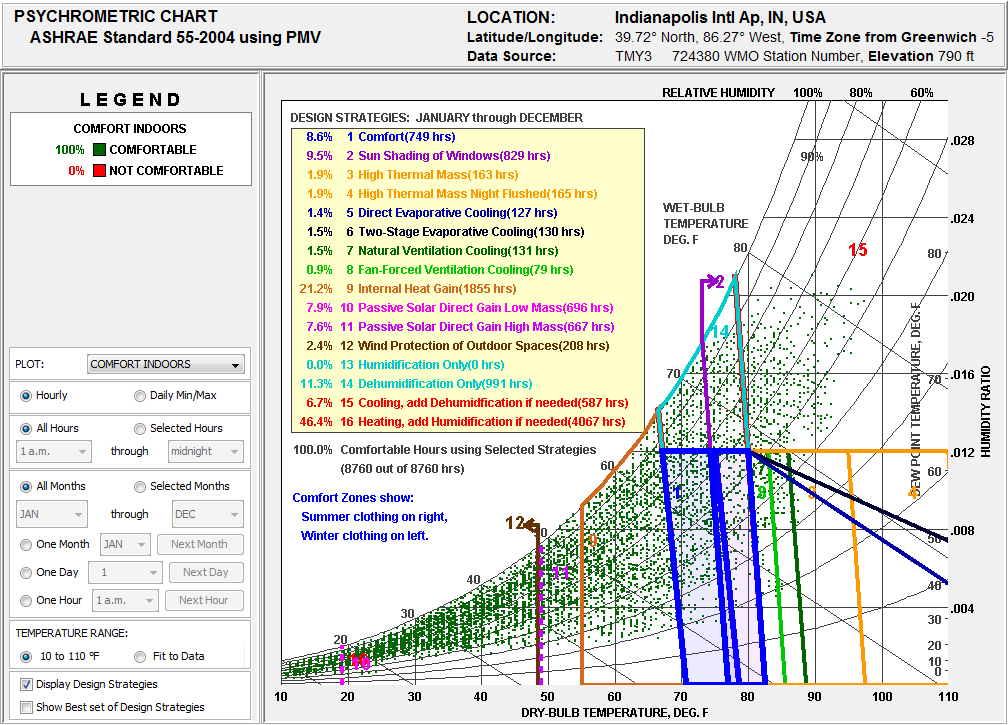
In the world of environmental systems, psychrometry is one of the most challenging topics to teach. The dynamic interplay of heat and moisture in the air, the correlation with human thermal comfort, and the conditional potential of various passive heating and cooling strategies is difficult to fully digest. However, I have found Climate Consultant's interactive Psychrometric Chart to be an immensely helpful visualization tool. Users can adjust a range of options in order to customize the chart as necessary.


Psychrometric Chart feature in Climate Consultant plotting hourly air-vapor data for an entire year with the potential impacts of various passive design strategies highlighted.


Wind Wheel

The Wind Wheel is a graphically rich visualization that aggregates hourly wind speed, wind direction, relative humidity, and ambient dry bulb temperature across a specified range of time. Users can change fields and even initiate a time-lapse expression of the wind data.


The Wind Wheel is popular feature in Climate Consultant through which users can visually represent a range of wind-related datasets.


Constantly Updating

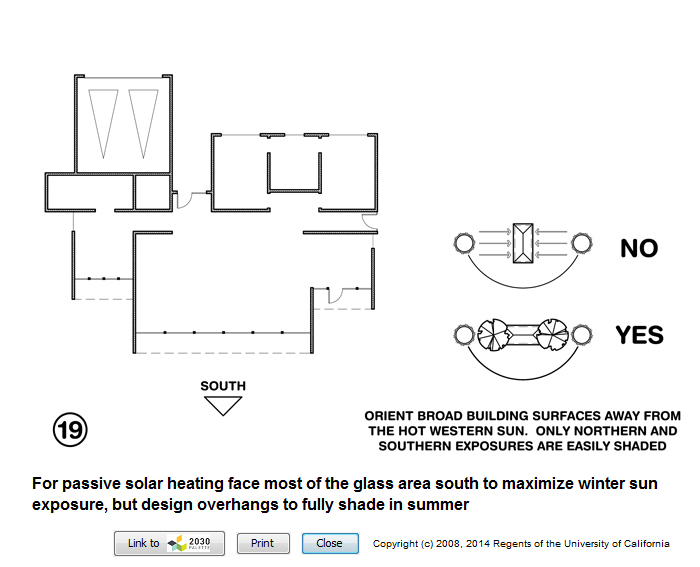
UCLA AUD is constantly updating the Energy Design Tools, including Climate Consultant. Two of the most intriguing recent enhancements to Climate Consultant has been the inclusion of a link between the Design Guidelines and the 2030 Palette for supporting examples and information and the ability to create Custom Plots of the weather data and calculated statistics.

Climate Consultant now links its Design Strategies with the 2030 Palette for supporting examples and additional information.


To download Climate Consultant, please visit the UCLA AUD Energy Design Tools web page: http://www.energy-design-tools.aud.ucla.edu/.

KEYWORDS: apps and software architecture consultants education severe weather

Share This Story

Overbey   head shot 2020 3

Daniel Overbey, AIA, NCARB, LEED Fellow (LEED AP BD+C, ID+C, O+M), WELL AP is an Assistant Professor of Architecture at Ball State University and the Director of Sustainability for Browning Day in Indianapolis, Ind. His work focuses on high-performance building design and construction, environmental systems research, green building certification services, energy/life-cycle assessment modeling, and resilient design. He can be reached at djoverbey@bsu.edu.

Recent Comments

These are actually very helpful tips. It is...

This is the most beneficial blog for all...

This blog is a great resource for anyone...

Thank you for sharing this important information. I...

This is a very interesting subject of the...

Manage My Account
  • Sign up for the Newsletter
  • Online Registration
  • Manage My Preferences
  • Registration Customer Service

More Videos

Sponsored Content

Sponsored Content is a special paid section where industry companies provide high quality, objective, non-commercial content around topics of interest to the Building Enclosure audience. All Sponsored Content is supplied by the advertising company and any opinions expressed in this article are those of the author and not necessarily reflect the views of Building Enclosure or its parent company, BNP Media. Interested in participating in our Sponsored Content section? Contact your local rep!

close
  • HITT Construction headquarters
    Sponsored byBuilding Composites® LLC

    Pushing the Envelope

  • 2 construction workers and a DEXcell panel
    Sponsored byDEXcell Roof Boards

    Designing Low-Slope Roofs for Resilience

  • Bell Bank headquarters in Fargo, North Dakota
    Sponsored bySto Corp.

    Drained and Back-Ventilated Rainscreens vs Pressurized-Equalized Rainscreens

Popular Stories

Open vs. closed cell foam in an attic

Open-Cell vs. Closed-Cell Spray Foam

graphic shows white arrows pointing to the right on a light green background

A Breakdown of Air Leakage Testing in LEED v5 BD+C

graphic shows a building destoryed by tornados with information on the amount of torandos in 2026 in the US

Record-Breaking Tornado Activity in Illinois Signals New Challenges for Architects

Building Enclosure Newsletter

BE Poll

Events

April 9, 2026

Strategies for High-Performance Below-Grade Waterproofing

Credits: 1 AIA LU/HSW ; 1 IIBEC CEH; 0.1 IACET CEU

On-Demand Designing a high-performance building enclosure requires more than just surface-level protection; it demands a rigorous, performance-based mastery of below-grade water and gas mitigation. This discussion will provide an expert-level analysis of below-grade waterproofing within the comprehensive framework of the high-performance building enclosure.

April 28, 2026

Roof Design Considerations That Prevent Installation Failures and Change Orders

Credit: 1 AIA LU/HSW; 1 IIBEC CEH; 0.1 ICC CEU

On-Demand This course provides visual examples of actual field conditions. Some good, some not so good; along with design suggestions that can cut installation costs and reduce construction change orders. Upon completion of this course, you will have a better understanding of the requirements the roofing contractor must meet to provide the specified roofing system warranty, and long-term value to the owner.

View All Submit An Event

Products

Plaster and Drywall Assemblies Manual

Plaster and Drywall Assemblies Manual

This is a comprehensive manual that goes beyond codes and standards, providing expert guidance in design, detailing, material selection and troubleshooting for plaster and drywall.

See More Products
×

Enhance your expertise with unparalleled insights.

Join thousands of building professionals today. Shouldn’t you know what they know?

SUBSCRIBE TODAY!
  • RESOURCES
    • Advertise
    • Contact Us
    • Store
    • Want More
  • SIGN UP TODAY
    • Create Account
    • Newsletter
    • Customer Service
    • Manage Preferences
  • SERVICES
    • Marketing Services
    • Reprints
    • Market Research
    • List Rental
    • Survey/Respondent Access
  • STAY CONNECTED
    • LinkedIn
    • Facebook
    • Instagram
    • YouTube
    • X
  • PRIVACY
    • PRIVACY POLICY
    • TERMS & CONDITIONS
    • DO NOT SELL MY PERSONAL INFORMATION
    • PRIVACY REQUEST
    • ACCESSIBILITY

Copyright ©2026. All Rights Reserved BNP Media, Inc. and BNP Media II, LLC.

Design, CMS, Hosting & Web Development :: ePublishing