
The U.S. Department of Energy's Office of Energy Efficiency & Renewable Energy (EERE) provides public access to long-term climate data for over 2,100 locations throughout the world in formats suitable for the publicly-funded EnergyPlus whole-building energy modeling software. These files are chock-full of hourly weather data of 30-year averages for temperature, humidity, wind speeds, and much more. For residential projects and other skin-load dominated (SLD) structures, these weather files hold the clues to better adapt our design responses to the environmental conditions they will encounter.
However, it is not clear to most designers how this information can be accessed and utilized in the design process. To state that the information contained in these weather files is dense and overwhelming would be an understatement.
For several years, I've taught environmental systems and building science courses for the Boston Architectural College’s online sustainable design certificate program and Master of Design Studies in Sustainable Design (MDS-SD) degree program. In those courses, I teach that a foundation of climate data analysis is critical to understanding what types of environmental control systems can make the biggest impact on reducing a building's heating and cooling needs. Yet, stringing together disparate web-based and printed resources for different types of climate information in various locations becomes confusing and problematic. We collect climate data in a systematic network of weather stations. There has to be a better way for students and designers to access this information.
Enter Climate Consultant
For years, Professor Murray Milne at the UCLA Department of Architecture and Urban Design (AUD) has provided several powerful, free software resources on his Energy Design Tools web page. One of the most popular programs is Climate Consultant, a free Java-based platform that takes all of that USDOE weather data and presents it in 17 different charts and/or tabulations - all of which are clear and intuitive visual expressions. Here are a few of the most compelling offerings of the software:
3D Charts
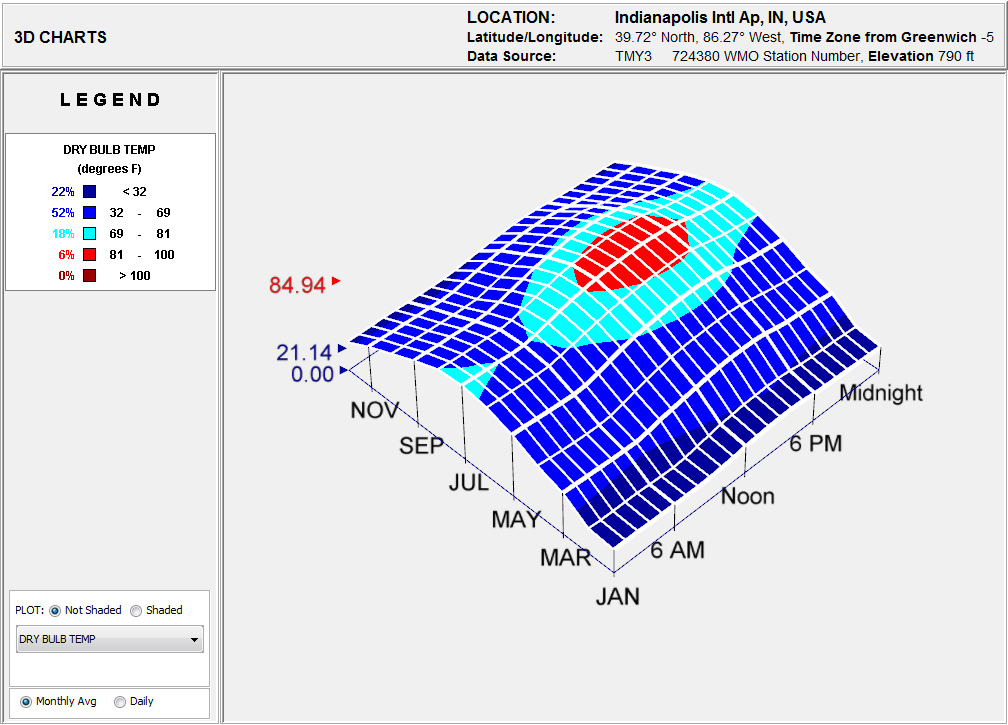
The 3D Charts allow users to visualize daily and monthly plots of weather datasets such as dry bulb temperature, relative humidity, and sky cover. Colors correspond with with categorical ranges and users can rotate the 3D visualization in order to better understand the relative variations in the dataset.
|
|
|
3D Charts feature in Climate Consultant plotting monthly averages of hourly dry bulb temperatures throughout the year. |
Psychrometric Chart
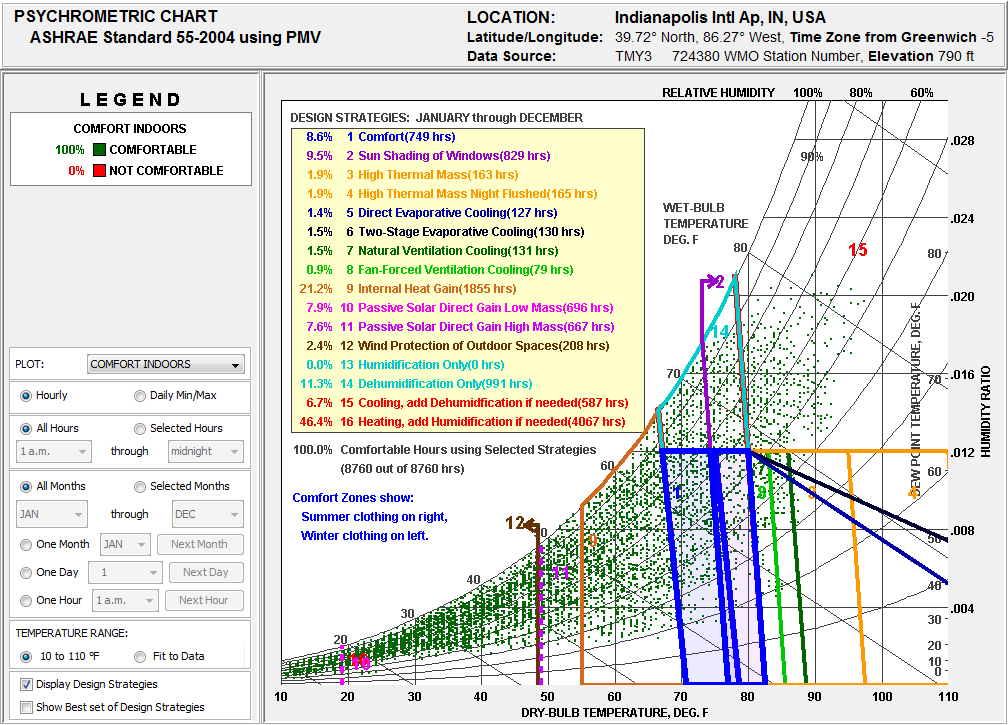
In the world of environmental systems, psychrometry is one of the most challenging topics to teach. The dynamic interplay of heat and moisture in the air, the correlation with human thermal comfort, and the conditional potential of various passive heating and cooling strategies is difficult to fully digest. However, I have found Climate Consultant's interactive Psychrometric Chart to be an immensely helpful visualization tool. Users can adjust a range of options in order to customize the chart as necessary.
|
|
|
Psychrometric Chart feature in Climate Consultant plotting hourly air-vapor data for an entire year with the potential impacts of various passive design strategies highlighted. |
Wind Wheel
The Wind Wheel is a graphically rich visualization that aggregates hourly wind speed, wind direction, relative humidity, and ambient dry bulb temperature across a specified range of time. Users can change fields and even initiate a time-lapse expression of the wind data.
|
|
|
The Wind Wheel is popular feature in Climate Consultant through which users can visually represent a range of wind-related datasets. |

Constantly Updating
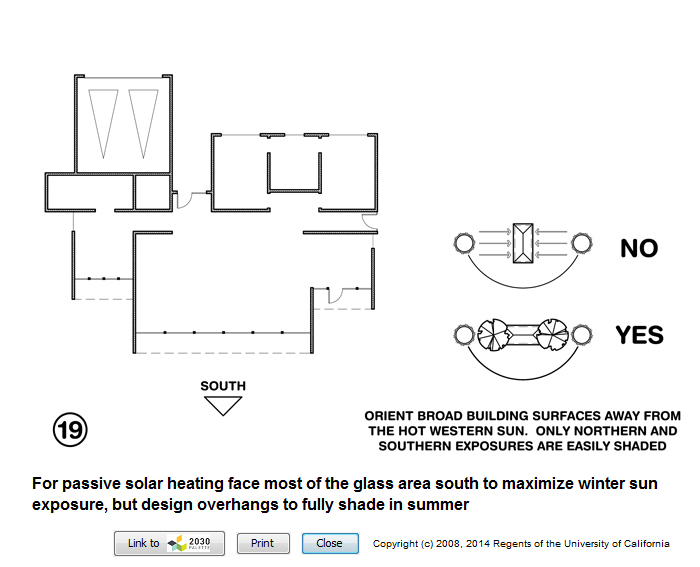
UCLA AUD is constantly updating the Energy Design Tools, including Climate Consultant. Two of the most intriguing recent enhancements to Climate Consultant has been the inclusion of a link between the Design Guidelines and the 2030 Palette for supporting examples and information and the ability to create Custom Plots of the weather data and calculated statistics.
|
|
|
Climate Consultant now links its Design Strategies with the 2030 Palette for supporting examples and additional information. |
To download Climate Consultant, please visit the UCLA AUD Energy Design Tools web page: http://www.energy-design-tools.aud.ucla.edu/.

Recent Comments
These are actually very helpful tips. It is...
This is the most beneficial blog for all...
This blog is a great resource for anyone...
Thank you for sharing this important information. I...
This is a very interesting subject of the...