Going for Zero Carbon? Do Not Forget About Transportation

Image courtesy of author.
The expanding definition of zero carbon buildings
One could define a "zero carbon" (or "zero net carbon") building as one in which carbon-based energy consumption is reduced first through building design strategies and energy conservation measures, then through on-site renewable energy generation, and finally through the procurement of locally produced off-site renewable energy and/or renewable energy credits and carbon offsets.
Increasingly, however, project teams are considering additional dimensions of carbon emissions resulting from a building project, including carbon emissions from water consumption, waste generation, occupant transportation, and the embodied carbon of materials used to build the project.
For example, USGBC's LEED Zero Carbon certification program recognizes that a building "provides a transparent accounting of the balance of carbon caused from energy consumption and occupant transportation to carbon emissions avoided or offset..."
Not an exact science, but we have to start somewhere
At a visceral level, we know that the combustion engines in our automobiles release greenhouse gas emissions. There are some great online resources (such as the EPA's Green Vehicle Guide) that allow anyone to quickly assess their personal carbon footprint from driving automobiles.
Rare, however, is the presentation of a practical method for putting occupant transportation emissions into the context of a building project.
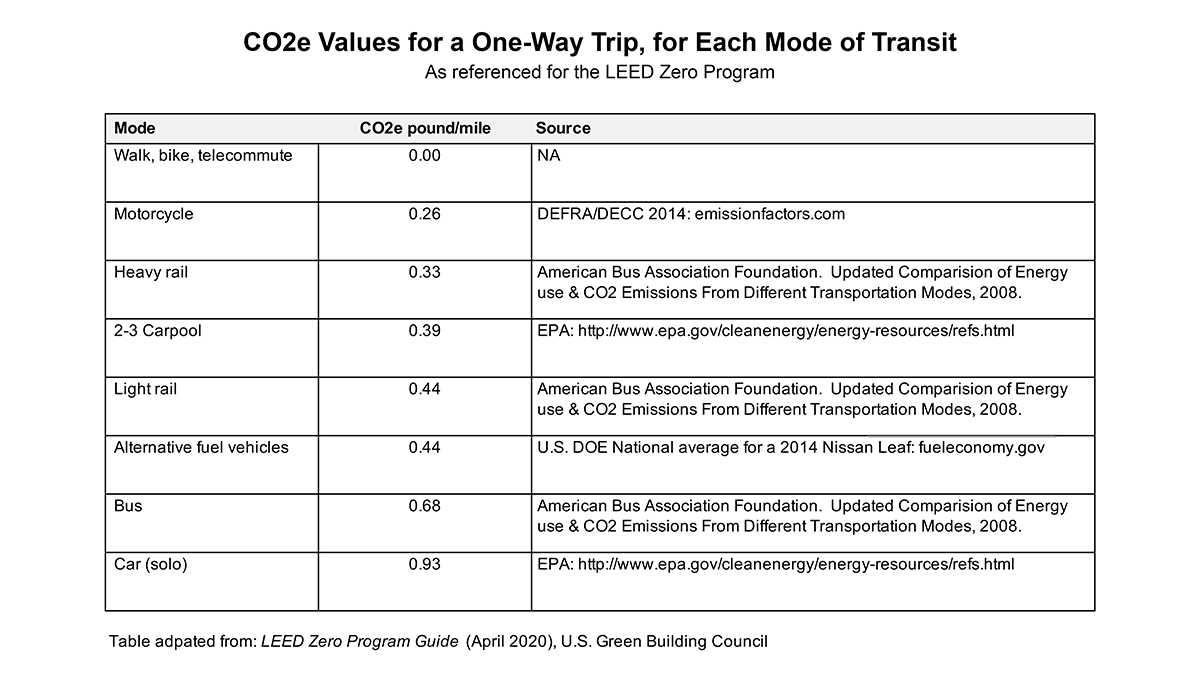
The LEED Zero Program Guide offers a broad-based method that can equate occupant survey data into annual pounds of CO2e emissions (the method uses carbon dioxide as a proxy for greenhouse gas emission). Based on miles traveled and the mode of transit, one may broadly assess the annual transportation carbon intensity of a building project.
|
Table: CO2e values for a one-way trip, for each mode of transit. Adapted from the LEED Zero Program Guide (April 2020) published by the U.S. Green Building Council. Table by Daniel Overbey. |
Transportation carbon intensity is a moving target
Like a building's energy performance, transportation carbon intensity will change over time. Regular checks via occupant survey will allow a team to benchmark and improve upon the annual CO2e value for transportation.
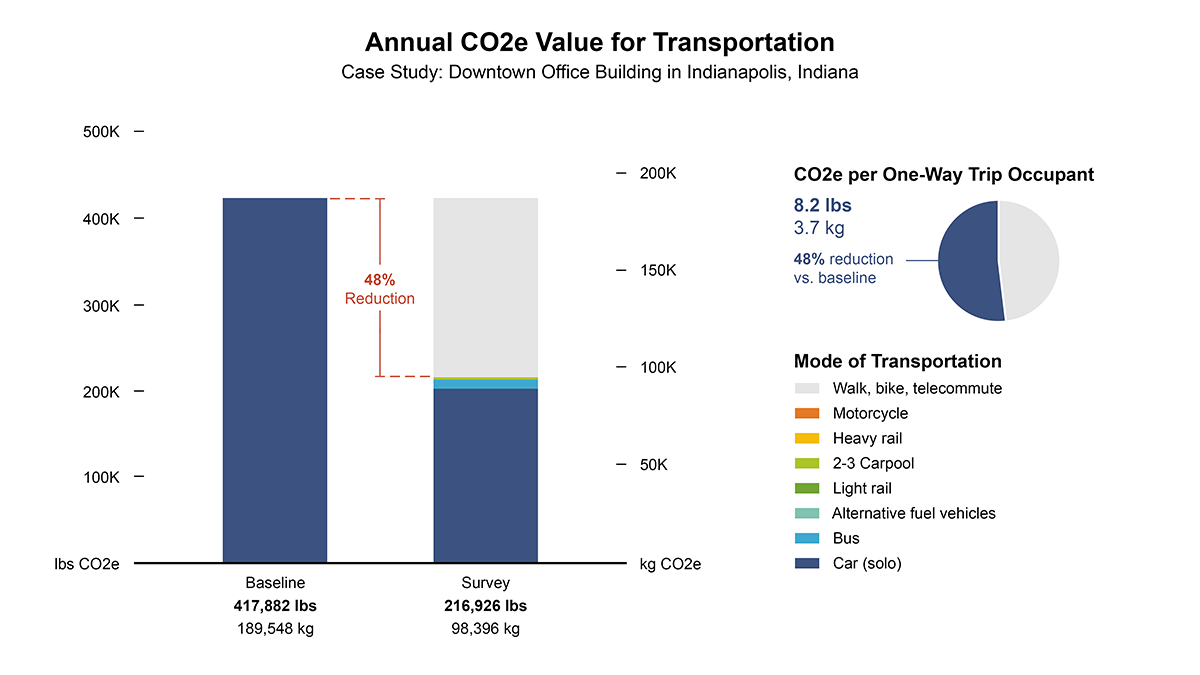
My firm recently assessed the transportation carbon intensity for a project in downtown Indianapolis. We achieved a 54% survey response rate and extrapolated the results to account for all occupants. Our baseline considered all transit miles in terms of single-occupant vehicles. The project is located in a dense, walkable urban environment and the company allows employees to work from home for two days out of the week.
The results of the survey revealed that walking, biking, and telecommuting combined for a 48% carbon reduction versus the baseline. It also revealed single-occupant vehicles as the dominant mode of transit.
The data also brought into focus an emerging metric to help contextualize transportation carbon intensity: CO2e per one-way trip occupant. In this example, the survey data revealed 8.2 lbs (3.7 kg) of carbon emissions per one-way trip occupant. By comparison, another project located in the suburbs of Indianapolis exhibited 25.5 lbs (11.6 kg) of CO2e per one-way trip occupant - a roughly three-fold increase versus the downtown project.
Again, one should keep in mind that this information is developed via user survey and will change over time - as will the tabulated CO2e values per mode of transit reference in the LEED Zero program. Calculating a building's transportation carbon intensity is not an exact science - but we need to start somewhere.
|
Figure 1: Case study of the annual CO2e value for transportation in an office building located in downtown Indianapolis, Indiana. Figure by Daniel Overbey. |
Transportation carbon in the context of zero carbon building
During the design development phases of a potential zero carbon project in the suburbs of Indianapolis, our project team assessed the building's transportation carbon intensity in the context of two design options: a standard office building designed to meet ASHRAE Standard 90.1-2010 (which is actually better than Indiana's 90.1-2007 based energy code) and a high-performance designed to reduce the project's EUI from 72 to 33 and achieve a 30% carbon reduction.
In the standard design, the transportation-related carbon accounted for 46% of the overall carbon intensity of the building. However, as the building design becomes more efficient, the greater the proportion of carbon resulting from transportation. In our high-performance design option, the transportation carbon accounted for nearly two-third of the annual CO2 value.
|
Figure 2: Case study of the annual CO2e value for energy in transportation in an office building located in the suburbs of Indianapolis, Indiana. Figure by Daniel Overbey. |
The definition of a zero carbon building will continue to evolve. However, even with the emergence of electric vehicles in a broad consumer market, it is clear that any holistic assessment of a building's greenhouse gas emissions should include the CO2e value of transportation - a value that may proportionately increase as we decarbonize our building stock.
