The Psychrometric Chart Explained
It is one of the intimidating charts for any building design professional: the psychrometric chart.
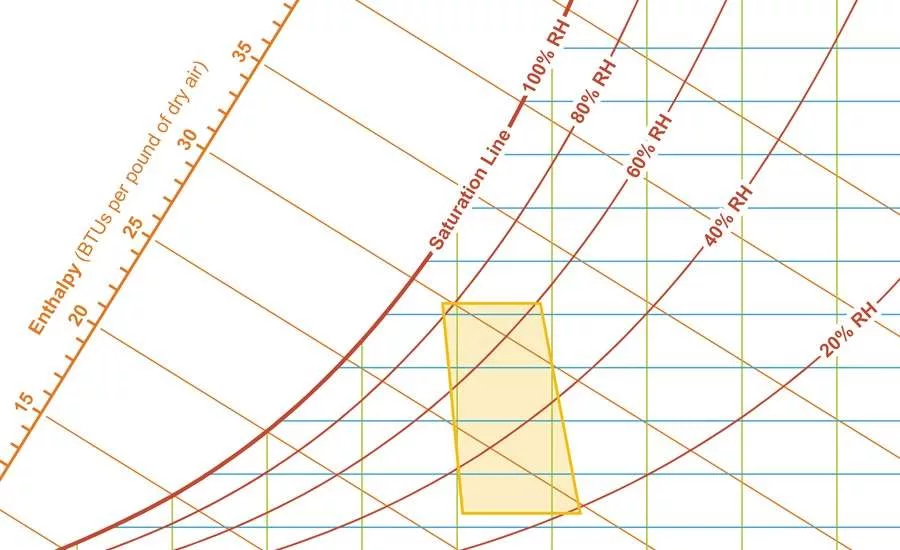
At first blush, the "psych chart" looks very complicated. There are layers of axes and curved reference lines. However, a closer examination will reveal that—at its essence—the chart is visually conveying the answers to two related questions:
- How much sensible (dry-bulb) heat is in the air? (See the green lines on Figure 1.)
- How much latent (moisture-related) heat is in the air? (See the cyan lines on Figure 1.)
Sensible Heat vs Latent Heat
Sensible heat is the “dry” heat in the air and relates directly to the dry-bulb temperature. This is the heat that one can "sense" with a conventional thermometer, as the term suggests. On the other hand, latent heat is the “wet” heat captured in the air as water undergoes phase change from liquid to vapor via evaporation or boiling. (See Thermal Dynamics: Visualizing Sensible Versus Latent Heat for a more in-depth explanation.)
Humidity Ratio and Relative Humidity
Latent heat is expressed on the psych chart in terms of pounds of moisture per pound of dry air. This is called the humidity ratio.
Air always has some amount of moisture in it. Proportionately, it is a very small amount of moisture relative to the overall air mass, but it is in there. Also, air can only hold so much moisture. As air gets warmer and expands, it has the ability to hold more moisture. As the air temperature drops, it has less capacity to hold moisture. This concept of the relative humidity (see the red lines on Figure 1) of an air-vapor mix at any given dry-bulb temperature helps one determine the saturation level of the air-vapor mix relative to its current capacity. (See Defining Humidity Ratio and Relative Humidity for a more in-depth explanation.)
Comfort Zone
Once the condition of an air-vapor mix is plotted on the psych chart, one can gauge the potential for human thermal comfort as a result of the combination of sensible and latent heat present (see the yellow zone on Figure 1). This comfort zone is defined by standardized comfort models from ASHRAE based on a range of conditions. (See Evaluating Human Thermal Comfort for more information about the factors that contribute to human thermal comfort.)
Enthalpy
Once the condition of an air-vapor mix is plotted on the psychrometric chart, one can determine the total amount of heat present in an air-vapor mix—also known as enthalpy (see the orange lines on Figure 1).
|
|
|
Figure 1: The psychrometric chart. Illustration by Daniel Overbey. |
Measuring Latent and Sensible Heat
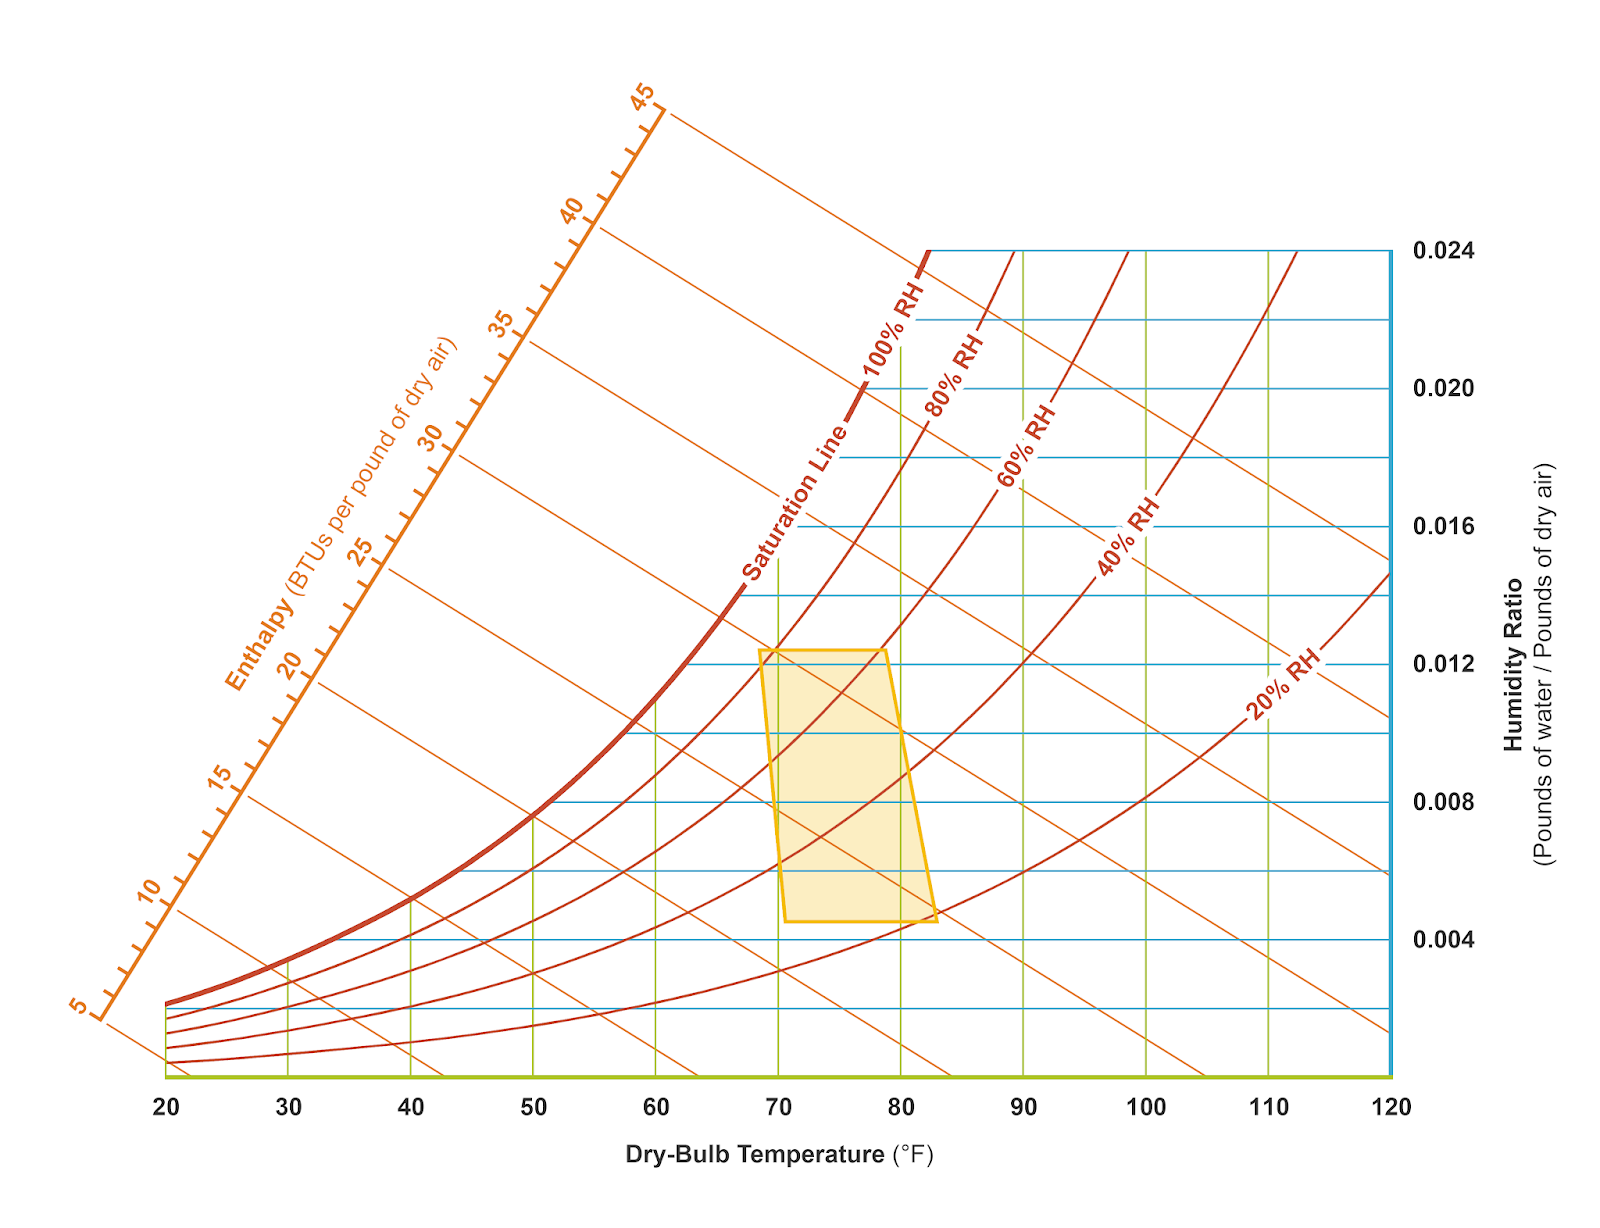
Any vertical movement on the psych chart represents a change in latent heat (Figure 2). Conversely, any horizontal movement on the chart represents a change in sensible heat (Figure 3). Both of these changes in the heat content of the air can be measured on the enthalpy scale.
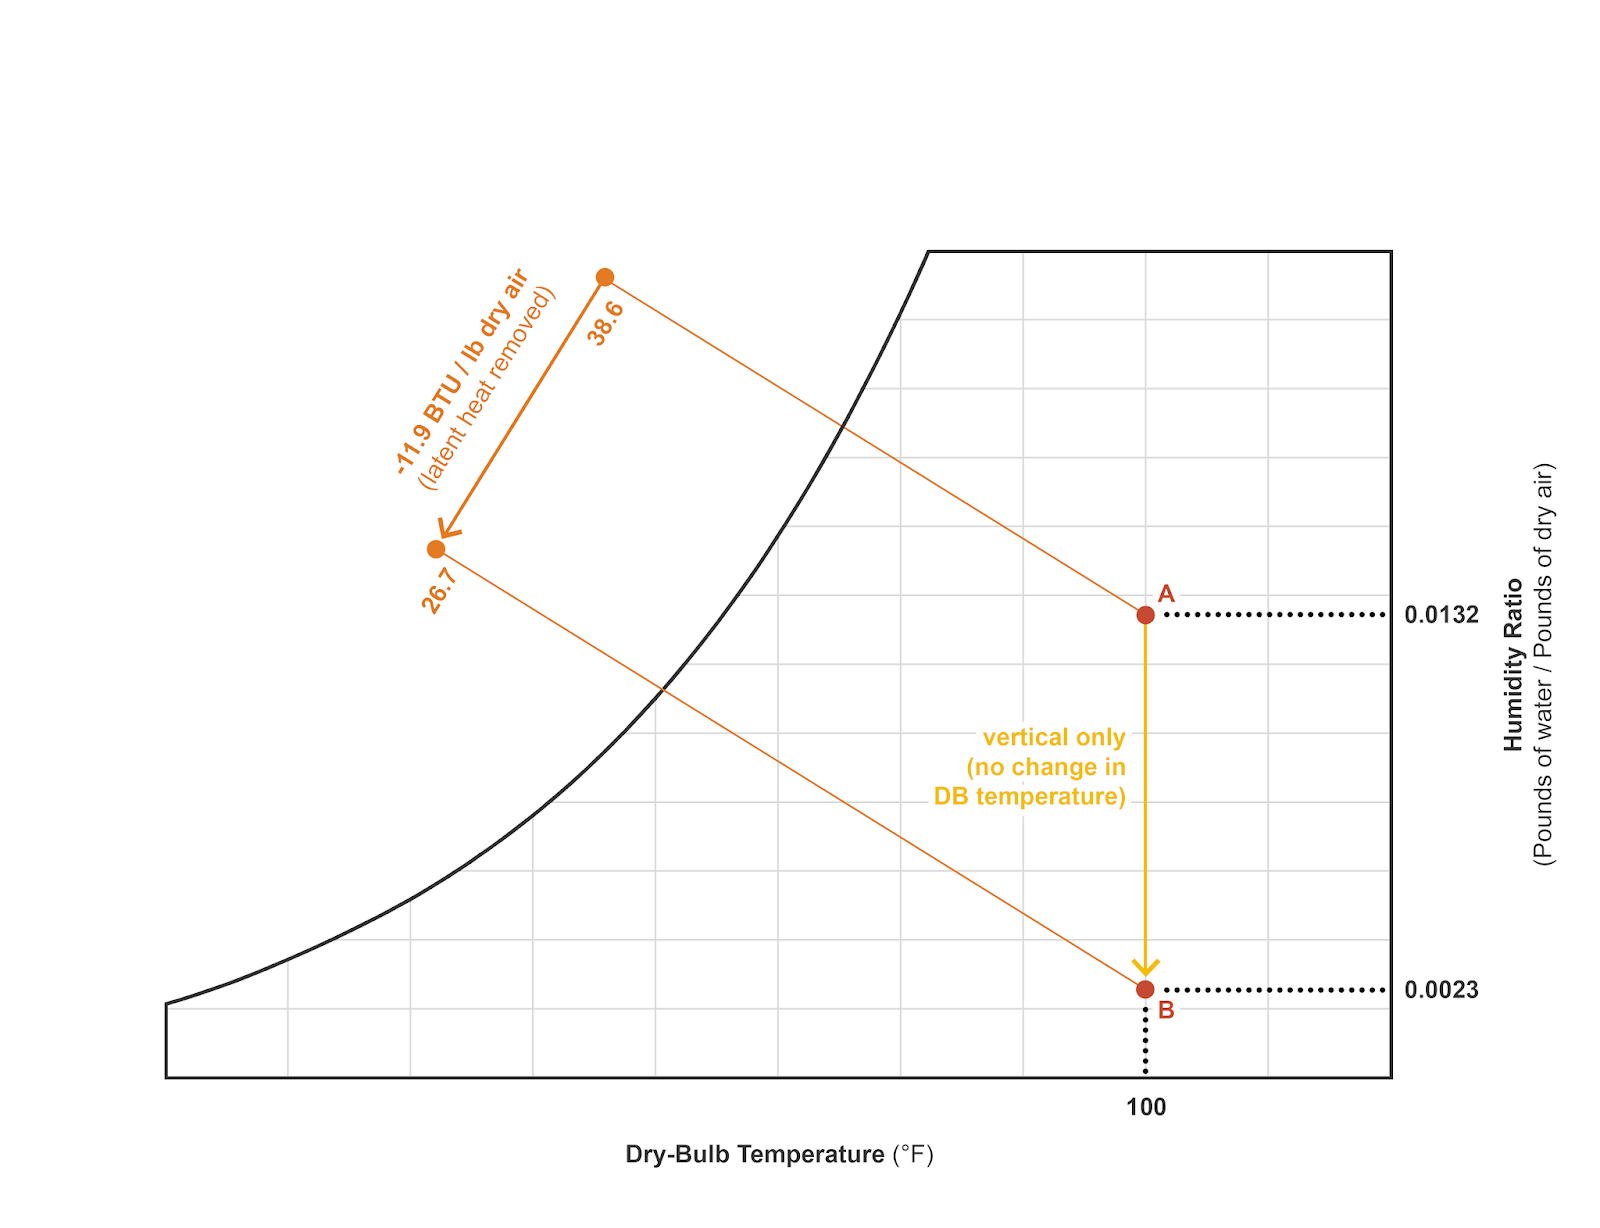
Note that diagonal movement is a combination of both vertical and horizontal movement (Figure 4). As such, it signals a change to both latent and sensible heat. This movement can be broken down into separate vertical and horizontal components in order to ascertain the proportion of latent and sensible heat removed from the total heat by the diagonal movement.
|
|
|
Figure 2: Determining change in enthalpy and latent heat due solely to changing latent heat (moisture; vertical-only movement on the chart). Illustration by Daniel Overbey. Adapted from Moore, 1993. |
|
|
|
Figure 3: Determining change in enthalpy and sensible heat due solely to changing sensible heat (dry-bulb temperature; horizontal-only movement on the chart). Illustration by Daniel Overbey. Adapted from Moore, 1993. |

|
|
|
Figure 4: Determining changes in enthalpy (latent and sensible heat) due to simultaneous change in humidity ratio and dry-bulb temperature (diagonal movement on the chart). Illustration by Daniel Overbey. Adapted from Moore, 1993. |
Visualizing Condensation
The psych chart can also be used to help one visualize the occurrence of condensation as sensible heat is removed and the dry-bulb temperature of an air-vapor mix is pulled below the saturation line for its given humidity ratio (Figure 5).
|
|
|
Figure 5: Dehumidification is achieved by cooling the air below the dew point temperature, causing condensation. Illustration by Daniel Overbey. Adapted from Moore, 1993. |
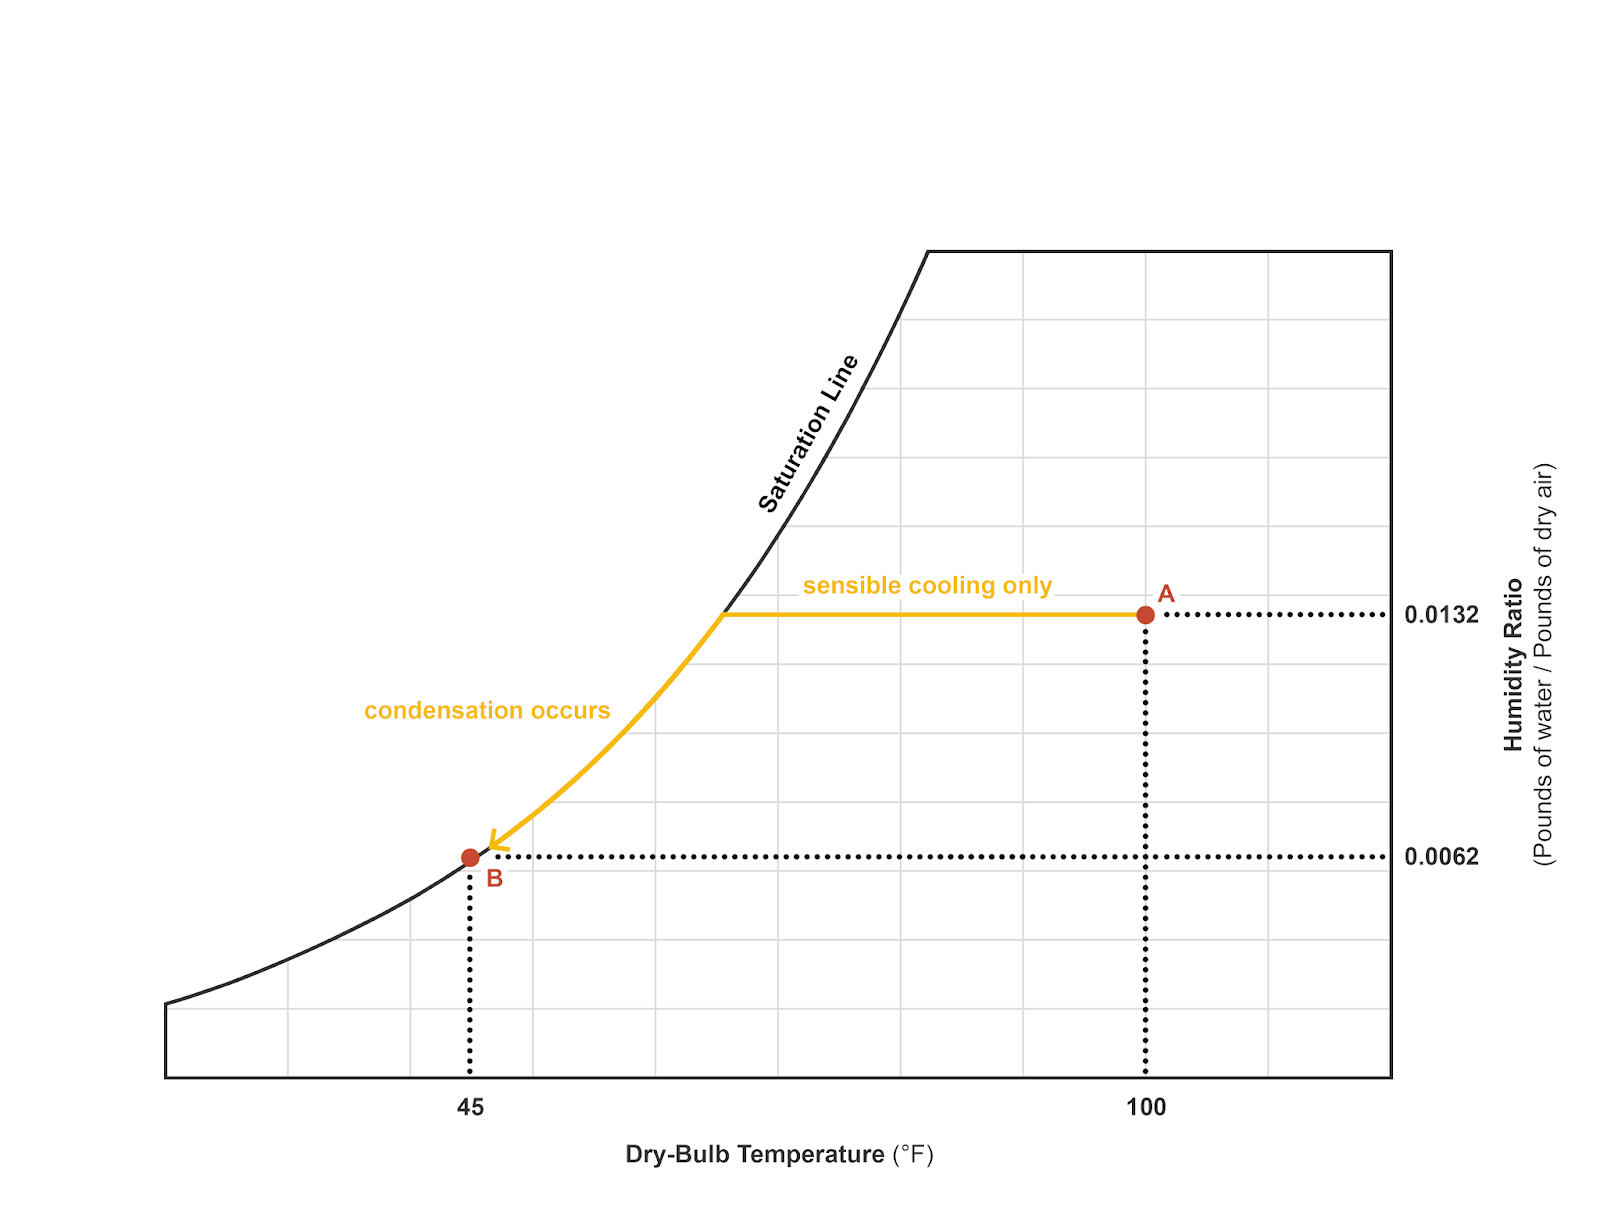
Dew Point
An example of this condensation occurrence would be when hot-humid indoor air comes into contact with a cool window surface during the winter. As the temperature of the air adjacent to this surface is pulled beyond the saturation line, its limit for holding moisture is reached and "dew" (i.e. water) starts to form on the cool window surface. This is the dew point—the critical temperature at which condensation occurs as the dry-bulb temperature of an air-vapor mix is lowered.
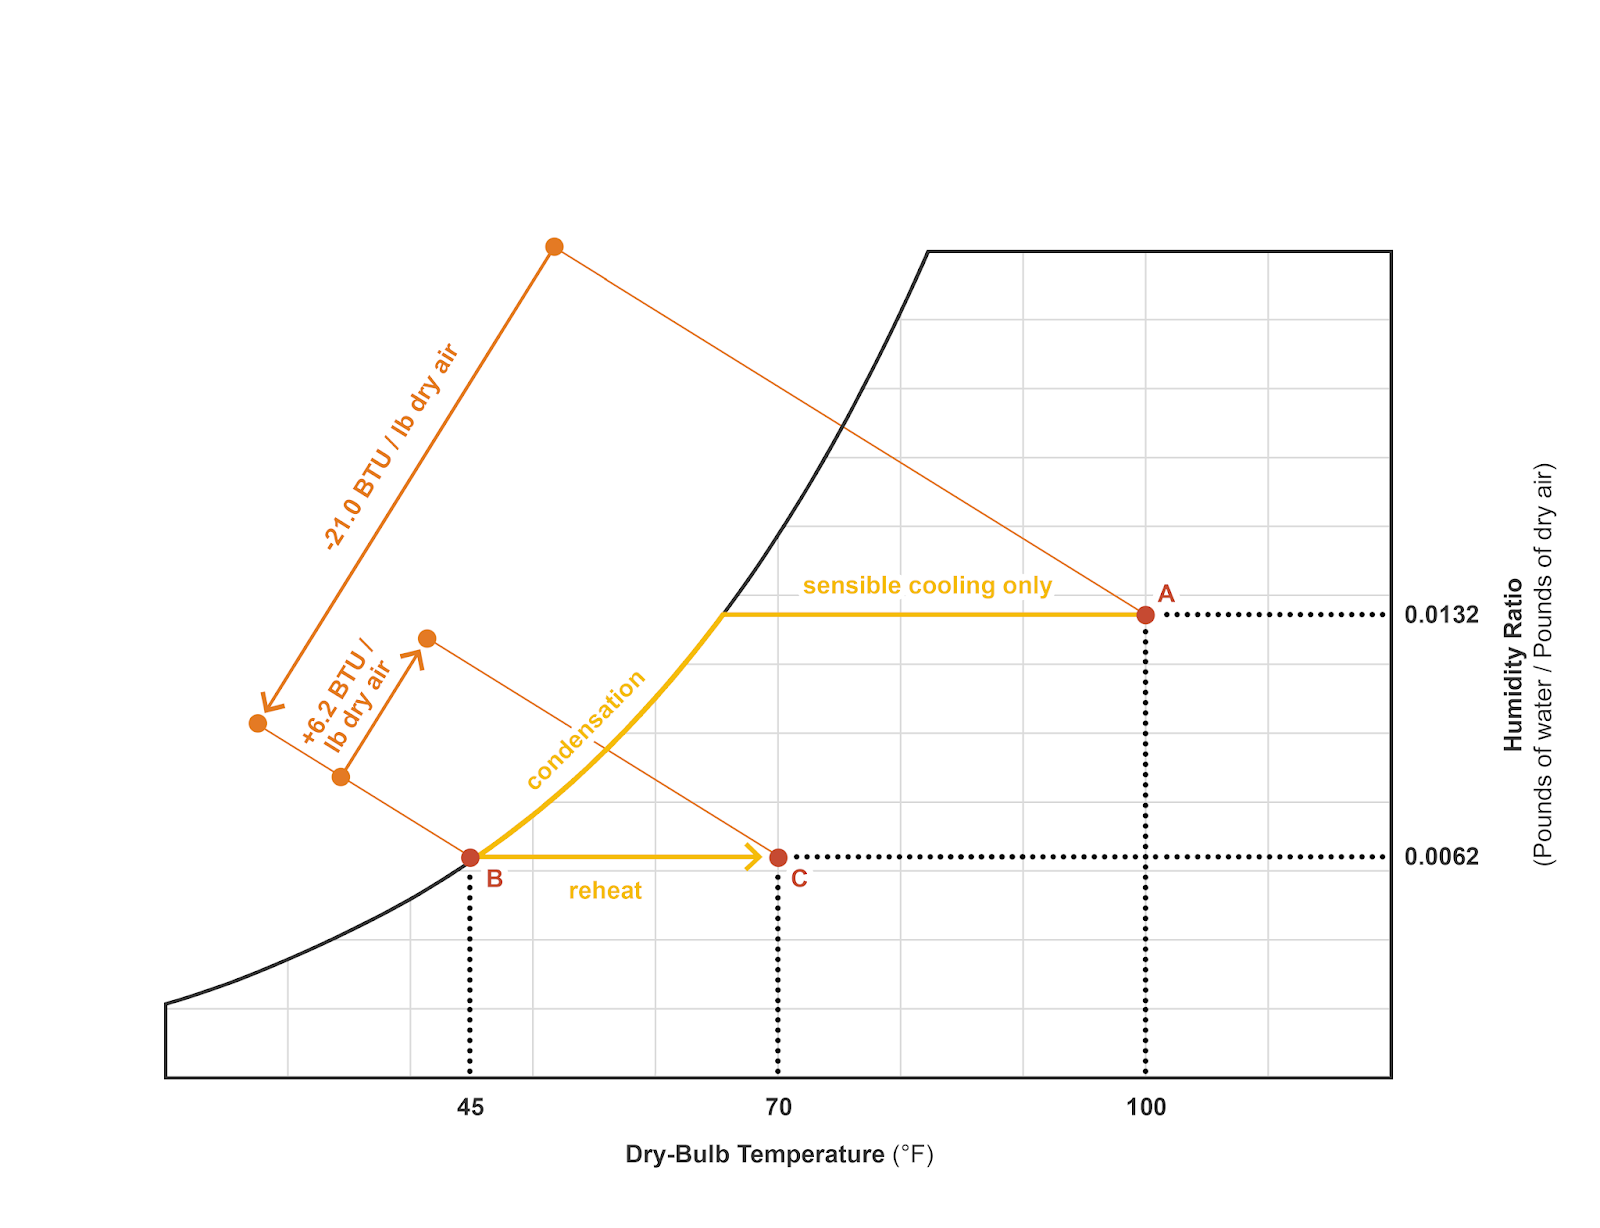
Reheating
After being cooled beyond the dew point temperature, the humidity ratio of the air-vapor mix will be reduced and the air will remain at 100 percent relative humidity. In order to lower the relative humidity, or to bring the conditions into the human thermal comfort zone, sensible heat will need to be added while the moisture content (latent heat) is maintained. As the the air-vapor mix is reheated, the condition moves horizontally to the right on the chart (Figure 6). This may seem like a roundabout and inefficient process.
However, this is representative of the typical mechanical air-conditioning process. HVAC systems usually change both the sensible and latent heat of an outdoor air stream by running it through hot and cold (and sometimes additional hot) coils to alter the sensible heat - and subsequently the humidity—of the air.
|
|
|
Figure 6: Mechanical cooling typically involves cooling air below the dew point until the desired humidity ratio is achieved, and then reheating the air to achieved the desired dry-bulb temperature. Illustration by Daniel Overbey. Adapted from Moore, 1993. |
Reference:
Moore, Fuller, 1993, Environmental Control Systems: Heating Cooling Lighting. McGraw-Hill, Inc., pp. 28-29.
