NCARB Releases Data on Education, Licensure & Diversity
The National Council of Architectural Registration Boards (NCARB) just launched its annual data report, NCARB by the Numbers. The 2017 edition provides exclusive insight into the number of U.S. architects, the value of graduating from an accredited program, the time it takes to earn a license, and diversity in the profession.
Key findings from the latest edition, which is based on data from the 2016 calendar year, include:
- Over 8,100 licensure candidates completed the Architectural Experience Program (AXP) in 2016—an all-time high.
- On average, candidates take 4.2 years to complete the AXP.
- Around 4,300 candidates completed the Architect Registration Examination (ARE) in 2016.
- Graduates from accredited architecture programs finish the ARE about five months sooner than their peers from non-accredited programs.
- Sixty-seven percent of candidates overlap their experience and exams—the largest percentage to date.
- On average, becoming an architect takes 12.5 years—from the time a student enrolls in school to the moment they receive a license. This marks the eighth year in a row the timeline to licensure has decreased.
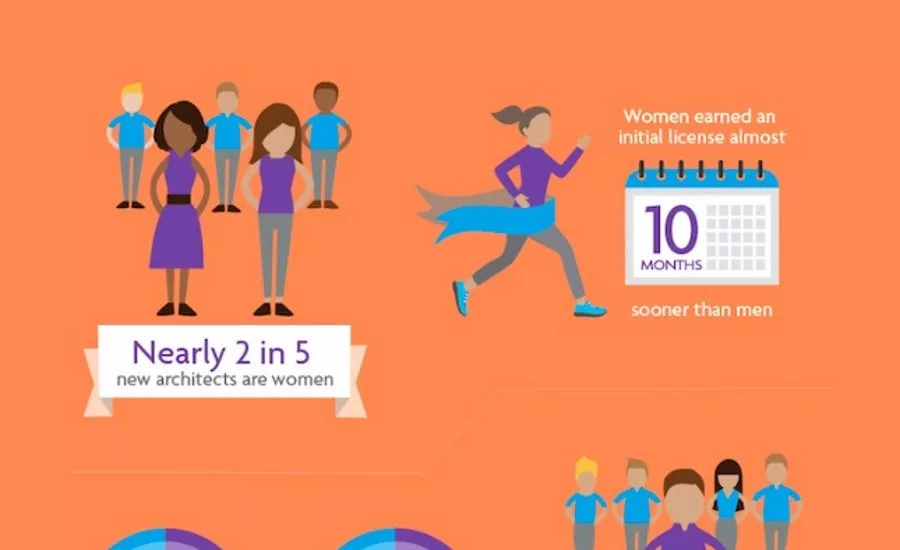
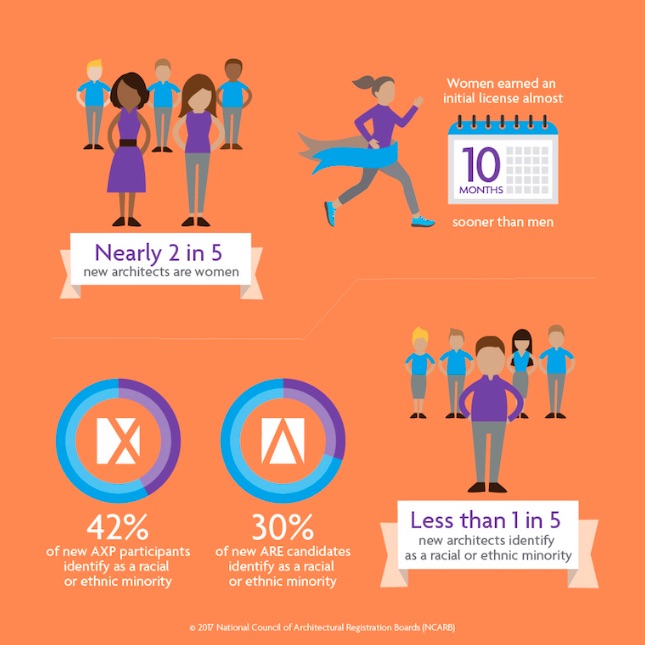
- The pool of candidates working toward licensure is more diverse than ever before, and 36 percent of newly licensed architects are women.
- In 2016, there were 109,748 architects in the United States—a minimal drop from the previous year.
“Every year, the profession turns to NCARB by the Numbers for comprehensive and insightful data on the path to licensure,” said NCARB President Gregory L. Erny, FAIA, NCARB. “As our data analytic capabilities expand, we are now able to shine a light on intriguing, and sometimes controversial, topics—including improving diversity among practitioners and shortening the timeline to licensure.”
The findings are pulled from the nonprofit’s database of over 111,000 NCARB-certified architects and licensure candidates, making NCARB by the Numbers the most comprehensive source for licensure statistics.
To read the full report, explore interactive data charts, and download infographics, visit www.ncarb.org/NBTN2017.
Looking for a reprint of this article?
From high-res PDFs to custom plaques, order your copy today!
.webp?height=740&t=1767036885&width=auto "Header - BE 1170x658 (002).png")

.webp?height=740&t=1755781744&width=auto "KEE(2).png")
.webp?height=200&t=1752598071&width=200 "NCARB(2).png")


