
A building's enclosure and mechanical systems must be designed to confront the weather extremes of its locale. The weather "extremes" can be described in myriad ways using several data. However, three of the most common are dry-bulb temperature, wet-bulb temperature, and degree-days.
Comparing Design Dry-Bulb Temperatures
Winter design dry-bulb (99%): This is the outdoor temperature that will, in a typical year based on long-term averages, , be the lowest experienced during 99% of the hours in a year. This means that approximately 1% of the hours (88 hours in a year) will experience temperatures lower than this value.
Summer design dry-bulb (2%): This is the outdoor temperature that will, in a typical year based on long-term averages, be the highest experienced during all but 2% of the hours in a year. This means that approximately 2% of the hours (176 hours) will experienced temperatures higher than this value.
Design teams typically forego designing for the most extreme percentile of hours in the winter or summer because to do so would risk over-designing a system and taking on an associated economic burden with very little return.
A review of the design dry-bulb temperature ranges between Winter and Summer for the 20 largest cities in the U.S. may bring some interesting observations to bare (Fig. 1). Although Denver gets really cold and Phoenix gets really hot, the U.S. Midwest must confront considerable extremes in both the heating and cooling seasons. Note the three cities with the greatest range:
- Chicago, IL (85.1)
- Denver, CO (84.7)
- Indianapolis (82.3)
|
Figure 1: Design Dry-Bulb Temperature Ranges for the 20 Largest Cities in the U.S. Figure courtesy of Daniel Overbey. Data: ANSI/ASHRAE/IESNA Standard 90.1-2007. |
.png)
Comparing Design Wet-Bulb
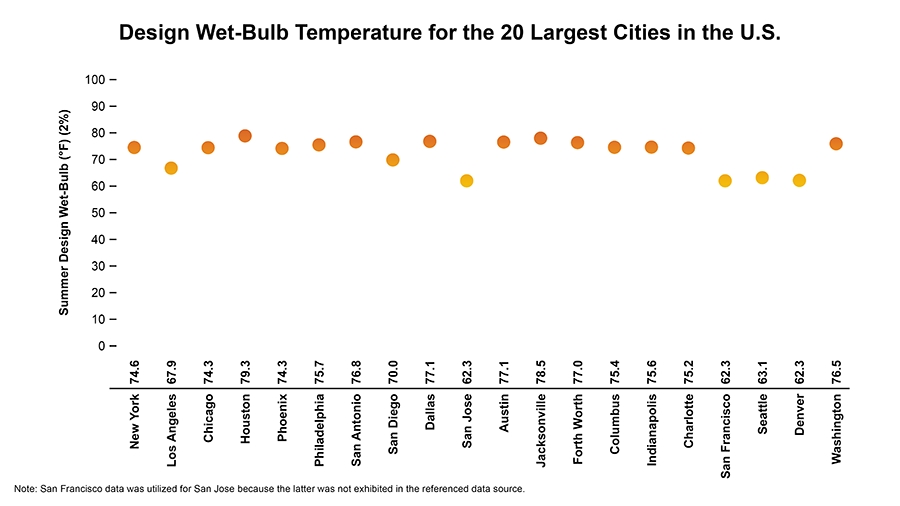
Design wet-bulb (2%): This is the outdoor temperature that will, in a typical year based on long-term averages, be the highest experienced during all but 2% of the hours in a year. This value is also used for the selection and sizing of evaporative cooling components.
A review of summer design wet-bulb temperatures in the largest cities in the U.S. reveals two key observations (Fig. 2). First, that the design design wet-bulb is fairly comparable for many cities - even in different climate regions. Secondly, the cities with design wet-bulb temperatures in the low 60's may be ill-prepared for increasing heating patterns in the summer as much of the population may lack mechanical air-conditioning and sufficiently resilient building enclosures.
|
Figure 2: Design Wet-Bulb Temperature for the 20 Largest Cities in the U.S. Figure courtesy of Daniel Overbey. Data: 2005 ASHRAE Handbook—Fundamentals. |
Comparing Degree-Days
One might also consider the total degree-days for this same list of cities.
If we consider the summation of the heating degree-days (base 65°F) and cooling degree-days (base 50°F), we see that the U.S. Midwest once again takes two of the top three positions (Fig. 3):
- Phoenix, AZ (9,535)
- Chicago, IL (9,477)
- Indianapolis, IN (9,068)
|
Figure 3: Heating Degree-Days (65°F) and Cooling Degree-Days (50°F) for the 20 Largest Cities in the U.S. Figure courtesy of Daniel Overbey. Data: 2005 ASHRAE Handbook—Fundamentals. |
.png)
If your city has one of the most challenging annual temperature ranges; if it has a summer design wet-bulb in the mid/upper 70's; and if it is among those with the greatest total degree-days including a considerable amount of heating needs (I'm looking at you, Chicago and Indianapolis), you will have a greater climate-related burden to contend with to achieve aggressive energy-performance goals.

Recent Comments
These are actually very helpful tips. It is...
This is the most beneficial blog for all...
This blog is a great resource for anyone...
Thank you for sharing this important information. I...
This is a very interesting subject of the...