
Behavioral Economics is focused on understanding how people, with all of our foibles and inadequacies, disrupt the pleasant simplicity of a marketplace full of rational actors. It began as behavioral psychologists started applying their findings to economics and marketplace decisions. The field has gone mainstream, with many best-selling books and Nobel Prizes in economics going to pioneers in the field. However, most businesses have yet to truly understand how significant this is. The building industry, largely B2B focused, has been slower than many B2C markets to incorporate this thinking. Why? Because all that behavioral economics stuff is about the average consumer, not the savvy business person making decisions, right? Wrong. We are all human, and subject to the same flaws in thinking. This issue is directly relevant in building industry purchase decisions, and we will show you why.
More Wine Please…But Not the Good Stuff
Most of us cannot tell a Pinot Noir from Oregon’s Willamette Valley from French Burgundy (which is made from 100 percent Pinot Noir grapes…a fact which needed to be researched to make this point). Many of us are lucky to distinguish a Cabernet Sauvignon from a Pinot Noir. But surely we know which wine we like the most, right? It depends. Researchers have shown that peoples’ preference for a selection of wines differs dramatically if the samples they receive include price information. In short, absent prices people prefer the cheaper wines but with prices suddenly their preference shifts to the expensive stuff. This has proven true both with the average consumer as well as members of a wine club1. The why is complicated, but basically price gets the brain firing differently, which leads to different perceptions. This example shows how powerful pricing can be on perception.
It’s the Numbers That Matter, Not the Dollars
You might think “OK, so people associate quality with price, I know that, so what?” If the findings were limited to price you might be right. They aren’t. This anchoring effect is really just about numbers. Researchers showed students an array of items, from wine to textbooks, and then asked them to write down the last two digits of their social security number, as if it were the price for the item in question. They were then asked to place an actual bid on the item based on their perception of its value.
Students whose last two social security numbers were high, 80-99, consistently bid more for the same items than those with low numbers,1-20. This held up across each item, with the high number crowd bidding at 300 percent more than the low. We might want to dismiss this saying “well these were students, surely I am savvier than that”…but these were MIT MBA students, obviously a fairly intelligent group. The bottom line is that the anchoring effect is real, we are all subject to it and it extends beyond actual price information.
Applications for the Building Industry
If we acknowledge that awareness of prices impacts our perception of quality, a good approach would be to evaluate product performance in isolation, no product names, no association with prices2. Below is data from the Building Science Corporation’s Thermal Metric Report, a landmark analysis of the performance of different insulation products, in typical wall assemblies, tested in conditions that mimicked those found in the real world3. The R-values shown are for full wall assemblies, so they represent total wall R-value, inclusive of the effects of air movement through the assemblies, thermal bridging etc. The only difference between them is the insulation used. The two values shown are basically very hot and very cold ambient conditions4.
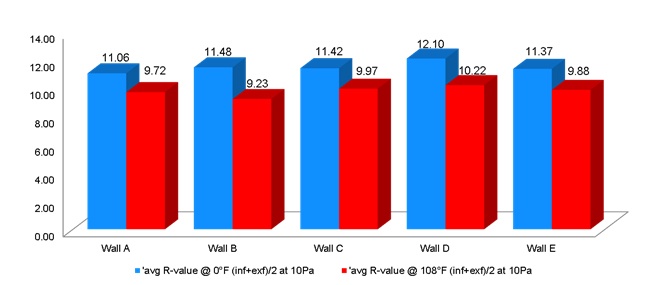
Looking at the data, Wall D is the top performer, though not by a lot. If we think insulation’s thermal performance should be tied closely to price, all these products should be within about 9.4% of each other (this is based on the biggest difference, the cold temp performance of Wall A, 11.06, vs. that of Wall D, 12.10). Now let’s look at this again with details on which product is in each wall:
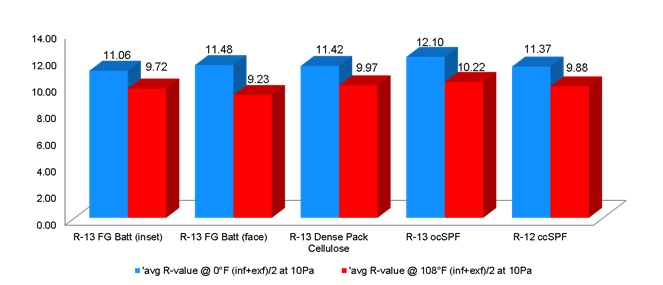
For many, seeing the product associated with the performance could be surprising. People in the building industry immediately know the price spread among these products is well beyond 9.4%. Certainly other factors go into the price of insulation besides thermal performance, but few would disagree that this is the primary benefit of the product and therefore should be the primary determinant of value. Upon seeing this data, does our perception of the relative superiority of each product immediately change? No, because we know there is more data out there.
More Info is Not Always Better
In an age of over abundant data we have come to believe more is better. From a decision-making standpoint the evidence to support this is dubious. Herbert Simon, a Nobel Prize winning economist said “A wealth of information creates a poverty of attention.” We can get caught up in small details that distract from the big picture. Lots of research bears this out, but a good example is one involving the stock market, with MIT’s business school students at it again. This time, one group was given a portfolio of stocks and the only info they had to make decisions was the movement in the stocks’ prices.
The other group could use any info they could get their hands on. The group with only the stock price traded far less often and ended up with a higher value portfolio than the group that could consume all the info they wanted. Similar results are seen when looking at passively vs. actively managed mutual funds5. The question we should ask is “what data really matters for my decision?” For insulation, and other building products, it should be about how they actually perform, in real-world applications, relative to their price. Looking at performance data stripped of connections to price, or any other preconceived notions, is a good place to start.
- These examples, and others in this blog, are drawn from Jonah Lehrer’s book How We Decide. For those interested, many of his findings are also referenced in this article from Inc.
- This is how testers in various Consumer Reports tests try out different products
- The full report can be found here
- The FTC requires labeled R-value be tested at 75 degrees mean, so this test was done at more extreme conditions than those applied for the R-values you typically see
- http://www.cnbc.com/2017/01/19/peak-passive-money-is-gushing-out-of-actively-managed-funds.html
For more on this and other great blog posts, visit The Insulation Institute's website.
Recent Comments
These are actually very helpful tips. It is...
This is the most beneficial blog for all...
This blog is a great resource for anyone...
Thank you for sharing this important information. I...
This is a very interesting subject of the...