
The wind rose is a conventional diagram for characterizing both the direction and frequency of wind around a project site. This graphic is commonly included in a climate data analysis.
Some software platforms such as Climate Consultant, one of several free energy analysis tools developed and released through the University of California, Los Angeles Department of Architecture & Urban Design, can generate wind roses for any specific range of time based on the climate data file loaded into the program (the U.S. Department of Energy manages an international database of climate data files through their Office of Energy Efficiency & Renewable Energy).
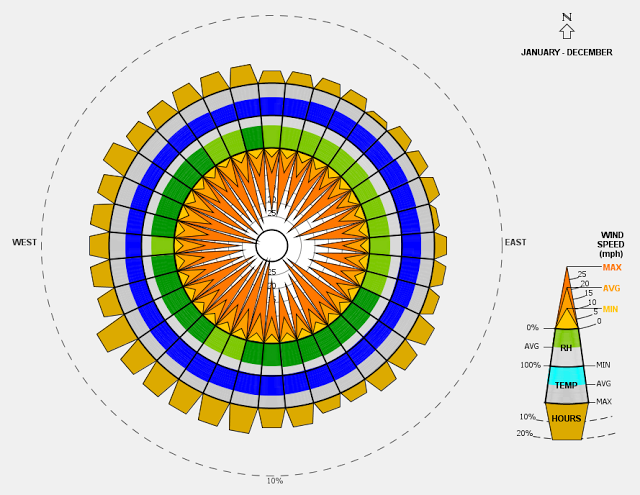
Annual wind rose for Indianapolis, Indiana, USA, generated by Climate Consultant 6.0 Beta.
Climate Consultant is available through the Department of Architecture and Urban Design at the University of California, Los Angeles.
Through its graphic clarity, the wind rose allows individuals to quickly determine the relative direction and frequency of winds at a weather station from which the data was recorded.
However, there are two common caveats with using wind roses for a project’s site analysis of energy flows.
First, if climate normals are used to generate the wind roses, then keep in mind that this macroclimate data was collected from a remote location and likely does not accurately represent the microclimate conditions at the project site. Any number of built and/or natural features in and around a site will alter the local climate data presented by the wind rose.
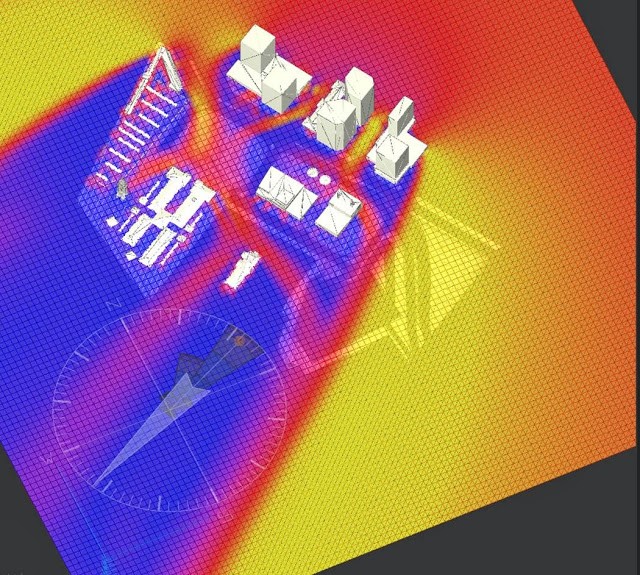
Prevailing wind directions can be altered around a site due to the natural and built context.
Image property of Browning Day Mullins Dierdorf.
Secondly, be careful about leaning too heavily on ‘prevailing’ wind directions for natural ventilation strategies.
By way of example, consider the wind roses below for Indianapolis, Indiana. Both the January and July wind roses indicate prevailing winds directions. In the winter, winds from the westerly directions (i.e., SW through WNW) will be a liability but for much of the year. Yet in the summer, prevailing southwesterly winds could be considered an asset. Buildings in this locale should consider operable windows on the southwest to catch these prevailing winds and corresponding outlets on the northeast. Stack ventilation outlets should not face the southwesterly direction.

January and July wind roses for Indianapolis, Indiana, USA.
Adapted from Climate Context: Information for Architectural Design by Mark DeKay and David C. Meyers.
However, upon further examination, it becomes apparent that natural ventilation strategies for this locale should not respond only to the prevailing southwestern direction. While July winds blow from the southwest more often than from any other direction, in aggregate the wind blows from a direction other than the prevailing direction over 80 percent of the time. Design teams would be wise to provide natural ventilation strategies that can function with a variety of wind directions in order to provide effective passive cooling for the greatest amount of time.

Recent Comments
These are actually very helpful tips. It is...
This is the most beneficial blog for all...
This blog is a great resource for anyone...
Thank you for sharing this important information. I...
This is a very interesting subject of the...