LEARNING OBJECTIVES
After reading this article, you should be able to:
- Understand the difference between net usage and peak demand charges and the role each plays in your electric bill. Using examples of typical electrical bills, learn how to identify and separate these two charges.
- Understand how peak demand charges are affected by thermal loads on your building and, most importantly, the roof on your building. Recognize the key types of thermal loads that have the greatest influence on peak demand charges.
- Understand how cool roof surfaces can be used to reduce peak demand- and related peak demand charges - in almost any climate.
- Learn to estimate potential peak demand charge savings for different roof systems using the free online "Cool Roof Peak Calculator" developed by the U.S. Department of Energy and Oak Ridge National Labs.
1 AIA LU/HSW; I GBCI CE Hour | Click here to take the quiz!
This paper reviews the concept of peak demand charges on electrical utility bills, and provides an analysis of the effect of cool or highly reflective roofs in reducing peak demand charges. The analysis suggests that peak demand charges may account for a significant portion of monthly electric bills across the United States and that cool roofs may provide an equally significant opportunity to reduce these charges when installed on air-conditioned buildings. The analysis also suggests that the peak demand and net energy savings offered by cool roofs are available for both new and existing conditioned buildings in all climates within North America.
Introduction
A sharp peak in electrical demand can be observed in almost every building during the busiest hours of the day. Although a share of this peak may be attributed to equipment used in the building, a significant portion is caused by increased demand for air conditioning in the heat of the afternoon. This peak in demand requires additional power plant capacity, causes imbalances in the power grid, and may result in increased air pollution. But most importantly for the building owner, peak demand may result in monthly charges many times higher than base electrical rates. One of the best approaches to shrink peak demand is to reduce the heat load on a building, especially the solar load that drives the need for air conditioning. Few heat reduction strategies can match the energy-savings potential of modern cool roofing technology.
In an effort to help building owners and designers deal effectively with peak electrical demand charges, this article provides a step-by-step review of all aspects of peak demand, including how to identify peak demand charges on a typical commercial electrical bill, how to estimate the potential savings achieved when installing a cool roof, and how to achieve other business and community benefits associated with reducing the peak energy demand. This information may be especially important since few articles to date on building energy savings have adequately addressed peak-demand issues.
How Businesses Pay for Electricity: Base Use and Peak Demand
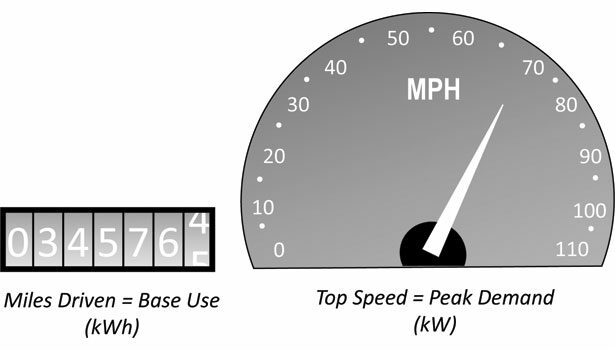
Although it may be convenient to focus simply on the bottom line of an electric bill, monthly electricity costs are composed of two distinctly different types of charges. The first is base energy use, which measures the total quantity of electricity supplied for the billing period. The second is peak energy demand, which measures the highest amount of power supplied at any one time within the billing period. Base energy use is measured in kilowatt-hours (kWh), while peak energy demand is measured in kilowatts (kW). One way to help understand the relationship between base energy use and peak demand load is to use the analogy of an odometer and speedometer in a car. As illustrated in Figure 1, the base amount of energy used (kWh) can be compared to miles driven, as shown on the odometer, while peak energy demand (kW) would be similar to the top speed driven, as shown on the speedometer.
Like the highest speed achieved during a trip, peak demand seldom occurs for more than a few hours, or fractions of hours, during each billing period. Typically, peak demand charges are based on the amount of energy consumed in a specified period of time known as a demand interval. Demand intervals are usually 15 or 30 minutes. To calculate a customer’s demand, the electric company takes the demand interval with the highest energy consumption in kilowatt hours (kWh), and divides by the length of the demand interval in hours. Mathematically, the hours cancel, leaving kilowatts (kW) as the units of peak demand.
Peak demand charges are a relatively new phenomenon in electric billing, but the concept of peak demand is closely related to a number of well-known electric power failures in the United States, including the state of California in 2000 to 2001 and the city of Chicago in 1995. In both of these cases, peak demand for electricity during prolonged heat waves exceeded the capacity of the electric grid, causing frequent brown-outs as well as occasional complete failure of the electric grid. In response to the severe effects when peak demand exceeds the capability of the electric grid, governments and utilities began to look for ways to reduce peak demand. This, in turn, has led to the incorporation of demand charges in many utility bills. As a result, many electric utilities across the United States now incorporate some level of peak demand charges in their monthly bills. To provide an example of how widespread the practice of peak demand billing has become, a simple Google search for “understanding peak demand” will generate links to peak demand charge information from electric utilities in California, Florida, Illinois, Indiana, Maryland, Massachusetts, New York, Ohio, and Pennsylvania. As an additional example, the U.S. Utility Rate Database1 maintained by the U.S. Energy Information Administration identifies hundreds of utility companies across the United States that currently incorporate peak demand charges in their monthly bills, especially for high-use commercial and industrial customers.
Base Use Versus Peak Demand: Looking At Your Electric Bill
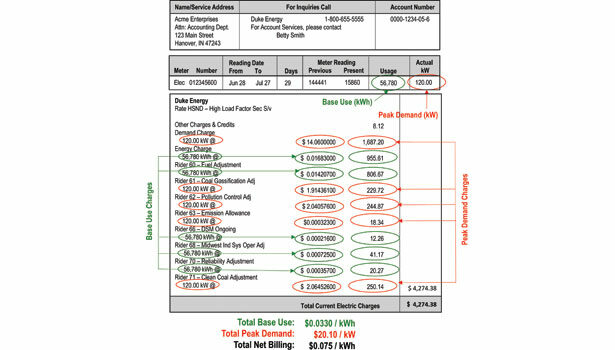
Because electricity is not easily stored, utilities must have adequate capacity to meet customers’ maximum requirements, both for the quantity of total level of base energy needed and for the highest level of peak demand required. As a result, commercial and industrial electric rates across the country frequently are designed to cover the cost of providing both base and peak energy. However, identifying these two cost components on the average commercial electrical bill may be a little difficult, especially when most bills are subdivided into a large number of special fees and adjustments. Figure 2 shows a typical commercial electrical bill containing both base use and peak demand charges, as published by an Indiana-based electrical utility2.
Near the top of the sample bill, monthly base energy use (circled in green) is shown to be 56,780 kWh. In the detail section of the bill, this base energy use is multiplied by a base energy charge as well as additional charges for fuel adjustments, demand side management (DSM) fees, regional system operator adjustments, and reliability adjustments. Altogether, these base energy use-related charges (also circled in green) add up to a total monthly base use charge of $0.033 per kWh.
However, this base fee accounts for less than half of this total monthly electric bill. Also near the top of the bill, peak demand (circled in red) is shown to be 120 kW. In addition to the base use fees discussed previously, the 120 kW of peak demand is multiplied by a basic peak demand charge plus additional demand-related charges for coal gasification adjustments, pollution control adjustments, emission allowances, and clean coal adjustments. Altogether, these peak demand-related charges (also circled in red) add up to a total monthly demand charge of $20.10/kW.
After calculating base use and peak demand charges, we also may calculate the total electricity rate for this customer. For this bill, the total monthly charge is divided by the 56,780 kilowatt hours used, yielding an effective rate of $0.075/kWh, or over twice as much as the nominal base usage rate of $0.0330. It should be noted that this total electric usage rate of $0.75/kWh is actually among the lowest commercial rates available in in the United States. According to the U.S. Energy Information Administration, average electric rates by state for commercial users in 2013 ranged from a low of $0.07/kWh in Idaho to a high of $0.15/kWh in New York3.
As illustrated by this sample bill, peak demand charges may account for a significant portion of a business’s monthly electrical costs. As a consequence, building owners frequently are interested in learning how these costs may be reduced, especially through the use of energy-efficient building design and operating strategies.
How Can You Reduce Peak Energy Demand?
As mentioned in the introduction to this article, peak energy demand for the majority of buildings occurs in the late afternoon, as occupant and building heat loads also tend to crest. For commercial facilities operating primarily during normal business hours, a number of key factors may help reduce the daily demand peak for electrical power. First, the ubiquitous use of electrical equipment in modern buildings may add to both base and peak demand for electricity. Electrical equipment may include motors associated with manufacturing operations as well as office equipment such as computers, copying machines, etc. Reductions in peak equipment demand may be achieved through the elimination of unnecessary equipment or by using equipment with improved electrical efficiency.
Excessive amounts of indoor lighting also add to base and peak electricity requirements. As a consequence, reducing the amount of lighting used during peak periods can be a useful strategy to reduce peak demand. Reductions in peak demand related to lighting can be achieved by reducing ambient lighting levels and installing task lighting, supplementing electric lighting with daylighting from windows and skylights, and installing more efficient light fixtures using fluorescent or LED technologies.
Although improvements in equipment and lighting may help reduce overall electrical demand, an important driver of peak demand in many commercial buildings is related to the spike in air conditioning requirement loads during the heat of the afternoon. Similar to equipment and lighting loads, peak air conditioning loads may be reduced by improving the efficiency of air conditioning systems or simply by turning up the thermostat. However, peak demand for air conditioning also may be addressed by reducing the impact of climate-related thermal loads on the building. In the case of air conditioning loads generated by high outdoor temperatures, overall air conditioning demand can be reduced by installing additional wall and roof insulation and thermally efficient doors and windows. But a certain amount of the peak in daily air conditioning demand is related to the direct rays of the sun rather than outdoor ambient air temperatures. This means that reducing solar loads by reflecting solar heat away from the building may offer one of the best ways to reduce peak electricity demand in modern buildings.
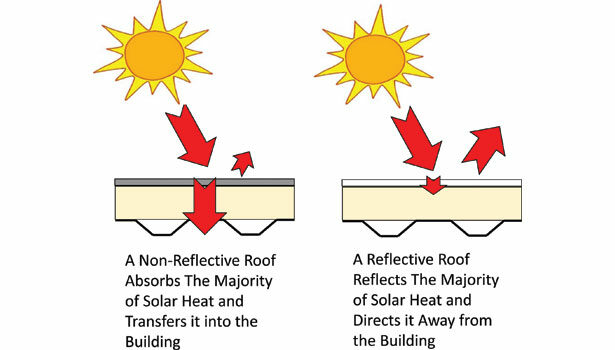
Fortunately, we have a well developed and effective technology available today to help reduce solar loads in buildings: the reflective or “cool” roof. Cool roofs use a highly reflective surface to direct a significant portion of solar heat from the sun away from the building. Unlike a dark or non-reflective roof surface that absorbs and transfers solar heat into the building, a light-colored, reflective roof surface reflects and drives solar heat away from the building and into the atmosphere.
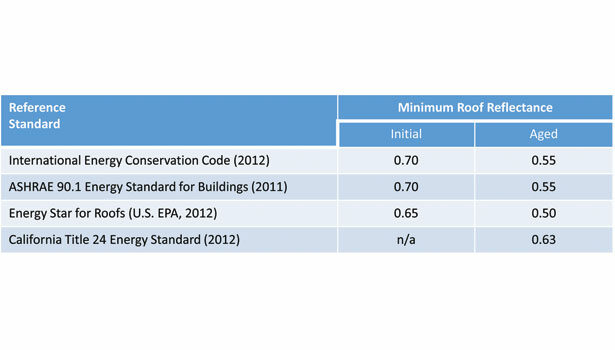
Cool roofs also are available using a wide variety of roofing technologies, including single-ply membranes, cool-surfaced modified asphalt systems, metal roofing panels, and a wide variety of roof coatings that may be applied to many different roofing surfaces. However, for any of these roofing products to be “cool” by today’s standards, the minimum percentage of solar heat reflected away from the building typically falls within a range of 0.50 (50 percent) to 0.70 (70 percent), depending on the particular standard being applied and on the aging of the sample tested. Table A provides a brief summary of these new and aged reflectance percentages for three of the most-recognized building codes and standards.
Because cool roofing has become a very popular roofing choice, roofing manufacturers typically identify the reflectivity of their products in technical data sheets and brochures. In almost all cases, these measures of roof reflectance are based on standards developed by the U.S. EPA EnergyStar program5 or the ANSI/CRRC-1 cool roof standard developed by the Cool Roof Rating Council6. In addition, both the U.S. EPA and the Cool Roof Rating Council maintain online databases where you can look up the initial and aged reflectivity of many roofing products.
Peak Demand: Not Just a Warm Climate Problem
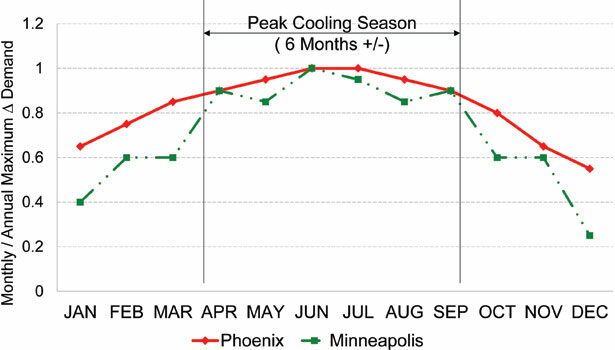
In order to better understand the benefits of cool roofs in reducing peak energy demand, researchers at Oak Ridge National Laboratories6 examined the seasonal variation in peak air conditioning demand for a variety of different climates across North America. Their findings suggest that even though base cooling demand may be higher in hot climates as compared to cooler climates, almost all climates exhibit a seasonal variation in the peaks for roof-related air conditioning demand. Figure 4 compares this seasonal trend for a hot, cooling-oriented climate (Phoenix, Ariz.) and a cold, heating-oriented climate (Minneapolis, Minn.).
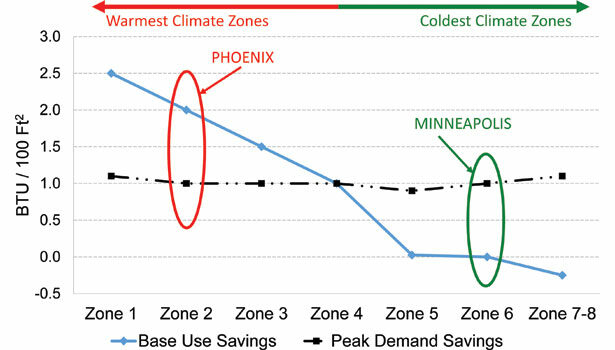
Although Phoenix exhibits a higher and more consistent monthly demand for air conditioning as compared to Minneapolis, demand falls off at the beginning and end of the year for both cities, with a substantial portion of peak demand located within a six-month period from April to September. As a result, it may be possible to reduce peak demand in both cities using cool roofing technologies. In fact, a recent study of cool roofs and peak demand costs suggests that the potential for roof-related peak demand savings for hotter cities like Phoenix and colder cities like Minneapolis may be approximately identical7. Figure 5 illustrates the comparative base energy and peak demand savings for the seven major climate zones in the U.S. identified in this study.
Although the colder climate zone for Minneapolis offers little or no savings potential in terms of base use, the opportunity for peak demand savings is approximately the same as in much hotter climate zones. Although it may seem counter-intuitive that similar peak energy savings may be achieved in cold climates as well as hot climates, Figures 4 and 5 taken together may help explain this apparent paradox. In a hot location such as Phoenix, even though overall cooling loads are very high, the seasonal peak is less pronounced, while the seasonal peak in a cold location such as Minneapolis is much more pronounced even though the overall cooling loads are smaller. In effect, peak demand savings in hot climates may be described as a smaller piece of a larger pie, while peak demand savings in cold climates may be described as a larger piece of a smaller pie.
Beyond the Dollars: Other Costs of Peak Energy Demand
So far we have discussed the immediate economics of peak demand, but there are other costs associated with peak demand that should be discussed as well. Because additional electrical generating capacity is required to meet peak demand levels, it is likely that this will lead to increased atmospheric pollution and environmental impacts due to the need to construct new generating facilities as well as the less-than-efficient operation of existing facilities. Peak energy demand also is strongly associated with the overall heating of large cities and urban areas, commonly referred to as the Urban Heat Island Effect. In turn, increased warming of urban areas may lead to increased production and accumulation of ground-level ozone, which in turn may lead to increased health risks and a growing number of “Ozone Action Days” in cities and towns across North America. Finally, increasing peak electricity demand may increase the potential for “brownouts,” especially during unusually hot weather events.
How to Estimate Peak Demand Savings
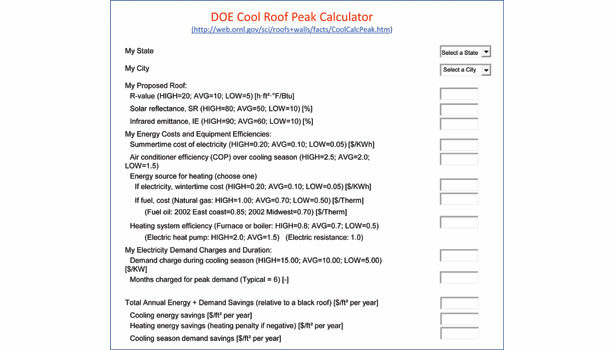
The good news for building owners and designers is that the U.S. Department of Energy has developed an online calculator specifically designed to evaluate peak demand and cool roofs: The Cool Roof Peak Calculator9. This online calculator, developed by Oak Ridge National Laboratory, provides a fast and easy way to compare the overall energy costs and savings for a wide variety of roof and building conditions. The calculator is easy to access and comes with step-by-step instructions for the user. Because the DOE Cool Roof Peak Calculator includes climate data for over 200 cities across North America, it’s easy to find a model location that can match up with almost any site in the United States or Canada. Unlike some energy calculators that model steep slope residential roofs with attics, the Cool Roof Peak Calculator models the typical low slope commercial roof with insulation placed directly over the deck and under the roofing membrane.
Figure 6 provides an illustration of a partial screen shot of the Cool Roof Peak Calculator from the Web site of Oak Ridge National Laboratory.
Using the DOE Cool Roof Peak Calculator is simple and straightforward, but some specific information is required to operate the calculator effectively. To obtain the maximum benefit from the calculator, the user must identify the following building attributes and conditions:
- Location. The user first must select a U.S. state or Canadian province and then select the closest city from a list provided for each state and province. As an example, the state of Ohio includes data for Akron, Cleveland, Dayton, Mansfield, Toledo, and Youngstown. For all states, an ample number of model cities is provided to allow the user in other cities to make an accurate climate-based comparison.
- Proposed Roof R-Value. If the calculator is being used by a building or roofing professional familiar with past and current energy codes, it is likely that the roof R-value may be estimated based on the age of the roof or building. For the non-professional, the calculator instructions provide suggestions for “high,” “average,” and “low” insulation R-value levels across North America.
- Proposed Roof Reflectance. Roof reflectance is stated as a ratio similar to the values shown in Table A. Roof reflectance for a specific roofing product may be obtained from roofing manufacturer data sheets or from the EPA Energy Star or Cool Roof Rating Council Web sites mentioned previously. Once again, the calculator provides suggestions for “high,” “average,” and “low” roof reflectance values. It should be noted that the aged reflectance value should be used in order to accurately estimate the long-term ability of the roof to reflect solar energy.
- Proposed Roof Infrared Emittance. Roof emittance is also stated as a ratio similar to roof reflectance. A full discussion of emittance is beyond the scope of this paper, but essentially it is a measure of the amount of solar energy absorbed into the roof but eventually transmitted back to the atmosphere rather than into the building. Roof emittance for a specific roofing product may be obtained from roofing manufacturer data sheets or from the EPA Energy Star or Cool Roof Rating Council Web sites mentioned previously. Once again, the calculator instructions provide suggestions for “high,” “average,” and “low” roof reflectance values. However, the values shown on the calculator may provide a much wider range than typically found in most low-slope roofing membranes. Typically, the thermal emittance of common single-ply and asphaltic roof coverings runs within a range of 0.75 to 0.90.
- Base Energy Costs. The calculator assumes that the building is being heated in the winter and cooled in the summer, but the user must identify the types of fuel used to heat and cool the building as required. Because the calculator assumes electricity will be used to cool the building, the user must enter the “summertime” cost of electricity in $/kWh, which is identical to the base use rate discussed previously. (Note that the peak demand charge for electricity is entered later in the calculation.) Next, the user must indicate the type of fuel (electricity, natural gas, or fuel oil) used to heat the building as well as the wintertime cost of the fuel. In the case of electricity, the cost is measured in $/kWh and is the same as the base use rate as determined from an electric bill. For natural gas and fuel oil, the cost is measured in therms. Again, the calculator instructions provide a suggested range of typical fuel prices across North America.
- Equipment Efficiencies. After identifying the types of fuel and their corresponding unit costs, the user must enter the efficiency for the air conditioning and heating equipment used in the building. Suggested efficiencies are provided in the calculator instructions.
- Electricity Demand Charges and Duration. Finally, the user must enter the peak demand charge for the building, measured in $/kW. As discussed previously, this demand charge should be determined from a recent electric bill as illustrated in Figure 2. In addition, the user must enter the duration of the peak air conditioning season for the building, which typically is a six month peak cooling season, as illustrated in Figure 4.
Based on the information provided by the user, the Cool Roof Peak Calculator then will provide an estimate of the total roof-related energy and demand savings for the building and roof system selected. In addition, this total cost amount is broken down into three key cost components:
- Cooling Energy Savings. This amount includes total air conditioning savings from both base use and peak demand reductions.
- Heating Energy Savings/Heating Penalty. This amount includes any changes in overall heating costs due to the cool reflective roof. Essentially, this estimate helps to account for any heating losses incurred in winter when solar radiation that could help heat the building is reflected back into the atmosphere.10
- Cooling Season Demand Savings. This is an estimate of the reduction in peak demand charges due to roof reflectivity. The amount shown is included in the cooling energy savings previously identified.
It is important to note that all costs provided by the calculator are stated in dollars-per-square-foot of roof area. As a result, these costs must be multiplied by the total square footage of roof surface area to estimate annual cost savings for the entire building.
It is also important to note that the DOE Cool Roof Peak Calculator is designed to compare the total roof-related net energy costs for a cool roof with a reflectivity as specified by the user to a black roof with a solar reflectance of 0.05 (5 percent). If the user wishes to compare two cool roofs with different reflective ratings, the user may run separate calculations on each roof and manually compute the difference in savings between the two roofs.
Applying the Cool Roof Peak Calculator
Now that we’ve reviewed the basic workings of the Cool Roof Peak Calculator, we can examine in greater detail what the calculator may reveal about base use and peak demand savings throughout the U.S. and Canada. Although it is difficult to accurately estimate exact base use and peak demand without a detailed examination of the construction and cost conditions for a specific building, it may be possible to develop a useful model by applying conservative assumptions suitable to a wide array of locations and buildings across North America. In order to develop an informative portrait of peak demand and cool roofs throughout the U.S. and Canada, this paper provides a climatic analysis for a typical cool roof versus a black roof using the following parameters applied to the Cool Roof Peak Calculator:
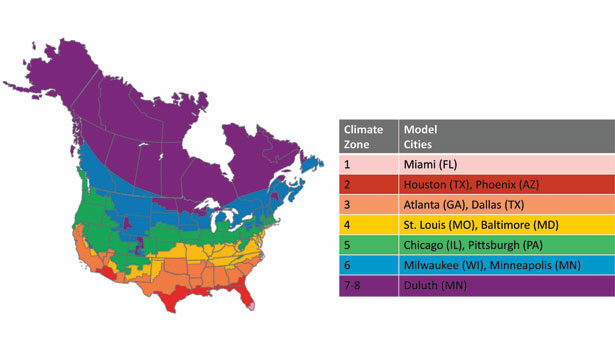
- Climate Zones and Model Cities. Current energy codes divide the U.S. and Canada into eight primary climate zones, with Zone 1 being the warmest, and Zone 8 the coldest. Within each zone, demand for heating and air conditioning tends to fall within a relatively narrow range, allowing for a similar thermal analysis of buildings within the climate zone. A map of the eight climate zones in the U.S. and Canada is illustrated in Figure 7.
Also included in Figure 7 is a listing of model cities used within the analysis. In the case of the most extreme zones, only one city has been selected since the zones are either small or sparsely populated. In the intermediate climate zones, however, two cities were selected and their climate data averaged to provide a more accurate representation for all cities within the zone. - Representative Commercial Building. Within all climate zones, a representative building was selected. For the purposes of this analysis, the building was assumed to be a low-rise structure of one or two stories with a flat roof area of 20,000 square feet. In addition, it was assumed that the building was cooled with an electric air conditioning system with a Coefficient of Performance (COP) of 2.0 and heated with a natural gas-fired furnace12 with an efficiency rating of 70 percent.
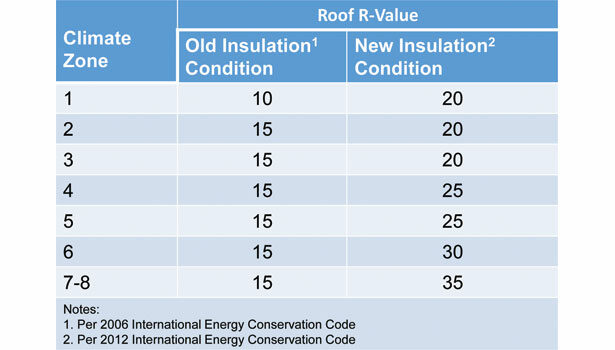
- Roof Insulation (R-Value) Level. Two insulation conditions were selected for the analysis to allow for a comparison of different roofing scenarios. The first condition (“new insulation”) assumes that the existing roof is completely removed and replaced with a new roofing system using R-value levels meeting the latest energy code requirements. The second condition (“old insulation”) assumes that the existing roof and insulation remains in place and is simply recovered with a new roofing membrane with no additional R-value. The new insulation condition is intended to model the installation of a completely new roof on an existing building or a newly constructed building, while the old insulation condition is intended to model the installation of a roof recovery over an existing roof that remains in place. Because the amount of roof insulation used in buildings varies according to climate zone, lower levels of insulation were assumed for the warmer climates and higher levels were assumed for colder climates. In addition, because code-mandated insulation levels have increased over the past decade, separate insulation levels were applied to the old and new insulation conditions. For the old insulation condition, R-value levels were based on an earlier (2006) version of the International Energy Conservation Code, and for the new insulation condition, R-value levels were based on the most recent (2012) edition of the code. These old and new insulation levels are summarized by Climate Zone in Table B.
- Roof Reflectance/Emittance. The long-term reflectance of most cool roofs tends to fall within a relatively narrow range, specifically from 0.55 to 0.63 for minimum aged reflectance as shown in Table A. Accordingly, the cool roof modeled in the analysis is based on a reflectance of 0.60, which falls approximately mid-range of the aged values in Table A. And because the Cool Roof Peak Calculator automatically compares this cool roof to a black roof with a reflectance of 0.05 and an emittance of 0.90, an emittance value of 0.90 also was selected for the cool roof.
- Base Use and Peak Demand Charges. Because the example electric bill from the state of Indiana shown in Figure 2 represents one of the lower rates available in North America, a comparison based on those rates obviously would provide a conservative estimate. As a result, the analysis assumes a base use rate of $0.033/kWh and a peak demand charge of $20.10/kW across all eight major climate zones. In addition, the analysis assumes a rate of $0.70/therm for natural gas, which is very close to the average commercial rate across North America at this time.
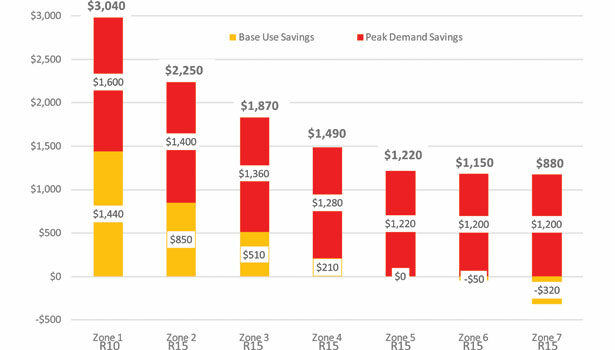
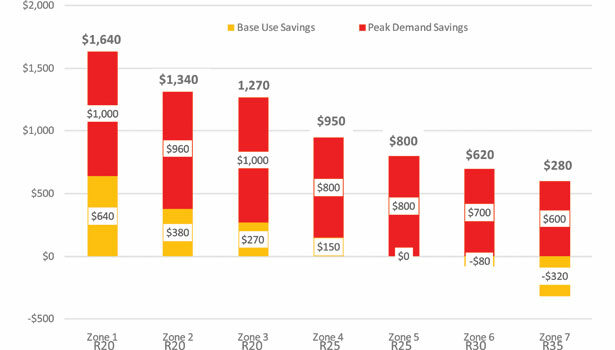
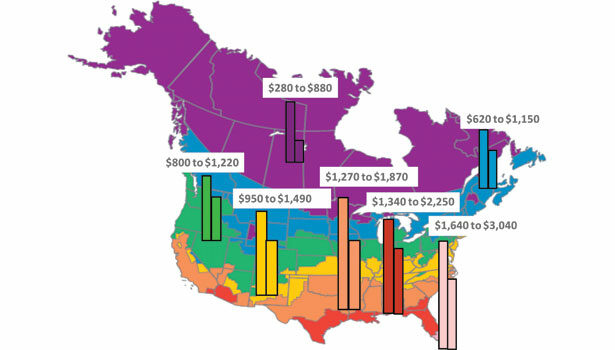
Using these assumptions and values, estimated base use and peak demand savings for a typical 20,000-square-foot commercial building in all eight climate zones were calculated using the DOE Cool Roof Peak Calculator. For each climate zone, two different roof conditions were examined. The first set of calculations compared a cool roof against a black roof installed over new roof insulation meeting the most recent energy code R-value requirements. The second set of calculations compared the same cool and black roof installed over existing (old) roof insulation meeting an earlier version of the energy code. The comparison of the cool versus black roof over new roof insulation is shown in Figure 8, and the comparison of the cool versus black roof over old insulation is shown in Figure 9. In addition, the range of savings available for both old and new insulation conditions is graphically portrayed on a map of the eight North America climate zones in Figure 10.
The Bottom Line: Cool Roofs and Peak Energy Demand Savings in all Climates and Conditions
As illustrated in Figures 8 through 10, the total value of base plus peak energy savings offered by the cool roof is sizeable, averaging more than $1,000 annually in most climate zones for a typical commercial building. In addition, these savings appear to be equally important for buildings with either “old” and “new” levels of insulation. As a consequence, cool roofs may offer a significant opportunity for net energy savings even at the highest levels of roof insulation mandated by the latest building codes. The savings value of cool roofs is further reinforced because modern cool roofing membranes frequently cost no more that darker non-cool roofs. As a result, all of the savings identified in the analysis tend to drop to the bottom line without any additional cost encumbrances.
Cool Roofs and Insulation Level
Differences in the level of new versus old insulation appear to have a significant effect on the amount of base use savings. In most cases, base use savings using the lower R-value levels of old insulation are reduced by half or more by the addition of the higher R-value levels of new insulation. However, this condition does not appear to hold for peak demand savings. In most cases, the savings available using either old or new insulation levels appears to be significant for all climate zones. As a consequence, it would appear that significant reductions in peak demand cost cannot be achieved simply by increasing insulation levels without also installing a cool roof covering.
Peak Demand Drives the Savings.
One of the most striking results from this analysis is that the estimated savings due to peak energy demand reduction provide a substantial majority of the net energy savings throughout all climate zones studied. In fact, peak demand savings account for over 50 percent of total savings in the warmest climate zones up to 100 percent in the coldest climate zones. In addition, while base use savings tend to vary widely by climate zone (even falling to negative values in the coldest climates), peak demand savings tend to be more significant and consistent throughout all climate zones. As a consequence, the analysis suggests that any estimate of cool roof savings that neglects to include peak demand reduction has little chance of providing an accurate estimate.
Effect of Fuel Selection on Net Energy Savings.
As stated previously, a natural gas forced air system was selected as the heating system for the building in these calculations. If electric resistance heat or an electric heat pump were selected in lieu of a natural gas system, the base use savings (shown in yellow in Figures 8 and 9) would decrease slightly due to an increased winter heating penalty applied to the electric heating system. In a similar manner, if an oil-fired furnace were selected in lieu of the natural gas system, the base use savings would increase slightly due to the higher cost of heating oil as compared to natural gas across the country. However, the peak demand savings (shown in red in Figures 8 and 9) would remain the same regardless of the heating system and fuel source selected. be
Notes:
1. U.S. Utility Rate Database. Available http://en.openei.org/wiki/Utility_Rate_Database
2. Derived from “Understanding Your Utility Bill: A Guide for Businesses in Indiana.” Duke Energy, Plainfield, Indiana (2013). Available http://www.duke-energy.com/pdfs/understand-bill-guide-in.pdf
3. 2013 Retail Commercial Electrical Rates by State (excluding Alaska and Hawaii) from U.S. Energy Information Administration “Electricity Data Browser.” For more information on average electric rates, please visit http://www.eia.gov/electricity/data/browser/
4. Although stated as a percentage in this table, roof reflectivity is typically expressed as a ratio in reference standards. Initial values shown are based on measurements of roofing material as manufactured, while aged values shown are based on measurements after field exposure of test samples.
5. For more information on the Energy Star rated roofing products, please visit http://www.energystar.gov/productfinder/product/certified-roof-products/
6. For more information on Cool Roof Rating Council rated roofing products, please visit http://coolroofs.org/products/results
7. Petrie, T. W., Wilkes, K. E., & Desjarlais, A. O. (2004). “Effects of Solar Radiation Control on Electricity Demand Charges – An Addition to the DOE Cool Roof Calculator.” Proceedings of the Performance of the Exterior Envelope of Whole Buildings IX International Conference, December 5-10, 2004.
8. Hoff, J. L. (2014). “Introducing the RoofPoint Energy and Carbon Calculator: A New Modeling Tool for Roofing Professionals.” Proceedings of the Second International Roof Coatings Conference, Baltimore, MD, July 14-17, 2014.
9. U. S. Department of Energy (DOE) Cool Roof Peak Calculator. Available http://web.ornl.gov/sci/roofs+walls/facts/CoolCalcPeak.htm
10. It should be noted that the Cool Roof Peak Calculator does not account for the potential for snow cover of the roof in the winter. The presence of accumulated snow on the roof surface may have two effects on overall energy savings. First, snow on either a cool or a dark roof surface will reduce the amount of solar energy absorbed into the building, which may increase heating costs. Conversely, a thick accumulation of snow may provide additional thermal insulation that may reduce heating costs.
11. Climate zones as defined by the International Energy Conservation Code and ASHRAE 90.1. Illustration courtesy of the Center for Environmental Innovation in Roofing and the Polyisocyanurate Insulation Manufacturers Association.
12. Natural gas was selected because it provides over 60 percent of all commercial building heating demand in the United States, according to the Commercial Building Energy Consumption Survey (CBECS) published by the U.S. Energy Information Administration (http://www.eia.gov/consumption/commercial/)